4.12 Chapter Summary
BioCast
1. Fluid Mosaic Model of Membrane Structure
Definition
- Fluid Mosaic Model: Describes the plasma membrane as a dynamic and flexible structure composed of a phospholipid bilayer interspersed with various proteins, cholesterol, glycolipids, and glycoproteins.
Phospholipid Bilayer Formation
- Phospholipids: Amphipathic molecules with hydrophilic (water-attracting) heads and hydrophobic (water-repelling) tails.
- Hydrophobic Interactions: Hydrophobic tails face inward, away from water, creating a nonpolar interior.
- Hydrophilic Interactions: Hydrophilic heads face outward towards the aqueous environment, both extracellularly and intracellularly.
- Bilayer Structure: Two layers of phospholipids arrange themselves with tails inward and heads outward, forming a stable barrier.
Protein Arrangement
- Integral Proteins: Embedded within the phospholipid bilayer; often span the membrane (transmembrane proteins).
- Peripheral Proteins: Attached to the surface of the membrane, either to integral proteins or to the polar heads of phospholipids.
- Fluidity: Lipids and proteins can move laterally within the layer, allowing membrane flexibility and the formation of microdomains.
2. Arrangement of Cholesterol, Glycolipids, and Glycoproteins in Cell Surface Membranes
Cholesterol
- Location: Interspersed among phospholipids within the bilayer.
- Function: Regulates membrane fluidity and stability; prevents membranes from becoming too rigid in cold temperatures and too fluid in warm temperatures.
Glycolipids
- Location: Carbohydrate chains are attached to lipids on the extracellular surface.
- Function: Involved in cell recognition and communication; contribute to the formation of the glycocalyx.
Glycoproteins
- Location: Carbohydrate chains are attached to proteins on the extracellular surface.
- Function: Play roles in cell recognition, signaling, and adhesion; also contribute to the glycocalyx.
3. Roles of Membrane Components in Cell Surface Membranes
Phospholipids
- Structure: Form the fundamental bilayer providing a semi-permeable barrier.
- Permeability: Allow selective passage of small, nonpolar molecules; restrict ions and large polar molecules.
Cholesterol
- Stability: Enhances membrane rigidity without compromising fluidity.
- Fluidity: Modulates the movement of phospholipids and proteins within the membrane.
Glycolipids and Glycoproteins
- Cell Recognition: Serve as identification tags; essential for immune responses and tissue formation.
- Cell Signaling: Participate in signal transduction pathways by interacting with extracellular signals.
Proteins
- Carrier Proteins: Bind and transport specific molecules across the membrane.
- Channel Proteins: Form pores that allow the passive movement of ions and small molecules.
- Receptors (Cell Surface Receptors): Bind ligands (e.g., hormones, neurotransmitters) to initiate intracellular signaling cascades.
Functions Overview
- Stability: Maintained by cholesterol and the structural arrangement of lipids and proteins.
- Fluidity: Essential for membrane flexibility and protein movement; regulated by cholesterol.
- Permeability: Controlled by the selective permeability of phospholipids and the presence of transport proteins.
- Transport: Facilitated by carrier and channel proteins for efficient molecule movement.
- Cell Signaling: Mediated by receptors that detect and respond to external signals.
- Cell Recognition: Enabled by glycoproteins and glycolipids acting as identification markers.
4. Process of Cell Signalling Leading to Specific Responses
Main Stages
- Secretion of Specific Chemicals (Ligands) from Cells
- Ligands: Molecules such as hormones, neurotransmitters, or growth factors released by signaling cells.
- Secretion Mechanism: Exocytosis or other vesicular transport methods.
- Transport of Ligands to Target Cells
- Delivery: Ligands travel through the extracellular fluid or bloodstream to reach target cells.
- Distance: Can involve short-range (paracrine) or long-range (endocrine) signaling.
- Binding of Ligands to Cell Surface Receptors on Target Cells
- Receptor Binding: Ligands specifically bind to their corresponding receptors on the target cell membrane.
- Receptor Types: Include G-protein-coupled receptors, tyrosine kinase receptors, and ion channel receptors.
Signal Transduction Pathway
- Activation: Ligand-receptor binding induces a conformational change in the receptor.
- Cascade: Initiates a series of intracellular events (e.g., phosphorylation) amplifying the signal.
- Response: Leads to specific cellular actions such as gene expression, enzyme activation, or changes in cell metabolism.
Specific Responses
- Physiological Changes: Adjustments in cell function to maintain homeostasis.
- Cellular Activities: Division, differentiation, movement, or apoptosis as dictated by the signal.
5. Processes of Movement into and out of Cells
1.1 Simple Diffusion
- Definition: Passive movement of molecules from an area of higher concentration to an area of lower concentration without the need for energy or transport proteins.
- Examples:
- Oxygen entering cells.
- Carbon dioxide exiting cells.
- Key Points:
- Driven by concentration gradients.
- No energy (ATP) required.
- Occurs directly through the phospholipid bilayer.
1.2 Facilitated Diffusion
- Definition: Passive transport of molecules across cell membranes via specific transport proteins.
- Examples:
- Glucose transport into cells using GLUT proteins.
- Ion movement through ion channels.
- Key Points:
- No energy required.
- Utilizes carrier proteins or channels.
- Specific to certain molecules.
1.3 Osmosis
- Definition: The passive movement of water molecules through a selectively permeable membrane from an area of higher water potential (lower solute concentration) to lower water potential (higher solute concentration).
- Examples:
- Water uptake by plant roots.
- Red blood cells swelling or shrinking in different solutions.
- Key Points:
- Type of simple diffusion specific to water.
- Influenced by solute concentration (solute potential).
- Can cause cells to become turgid, plasmolyzed, or crenated.
1.4 Active Transport
- Definition: The movement of molecules against their concentration gradient, requiring energy (ATP) and transport proteins.
- Examples:
- Sodium-potassium pump in animal cells.
- Proton pumps in plant cells.
- Key Points:
- Requires energy input.
- Moves substances from low to high concentration.
- Essential for maintaining cellular homeostasis.
1.5 Endocytosis
- Definition: The process by which cells engulf large particles or macromolecules by forming vesicles around them.
- Types:
- Phagocytosis: Ingestion of solid particles (e.g., white blood cells engulfing pathogens).
- Pinocytosis: Ingestion of fluids and dissolved substances.
- Key Points:
- Energy-dependent.
- Involves vesicle formation.
- Used for large or complex molecules.
1.6 Exocytosis
- Definition: The process by which cells expel materials in vesicles that fuse with the plasma membrane.
Examples:
- Release of neurotransmitters.
- Secretion of hormones.
Key Points:
- Energy-dependent.
- Involves vesicle fusion with the membrane.
- Essential for removing waste and exporting materials.
6. Investigating Simple Diffusion and Osmosis
2.1 Using Plant Tissue
- Method: Place plant cells (e.g., potato slices) in solutions of varying concentrations.
- Observations:
- Hypotonic Solution: Cells become turgid.
- Isotonic Solution: No change in cell size.
- Hypertonic Solution: Cells become plasmolyzed.
- Conclusion: Demonstrates osmosis and the effect of water potential on plant cells.
2.2 Using Non-Living Materials (Dialysis Tubing and Agar)
Dialysis Tubing:
- Setup: Fill dialysis tubing with a solute (e.g., glucose) and place in different solutions.
- Observation: Movement of water into or out of the tubing based on solution concentration.
Agar Blocks:
- Setup: Embed substances (e.g., dyes) in agar blocks of varying sizes.
- Observation: Rate of diffusion changes with surface area to volume ratio.
- Conclusion: Models simple diffusion and osmosis, highlighting the importance of membrane permeability and surface area.
7. Surface Area to Volume Ratio (SA:V Ratio)
7.1 Principle
- Definition: SA:V ratio decreases as the size of an object increases.
- Implications: Larger cells or organisms have a lower SA:V ratio, affecting diffusion rates and metabolic efficiency.
7.2 Calculations for Simple 3-D Shapes
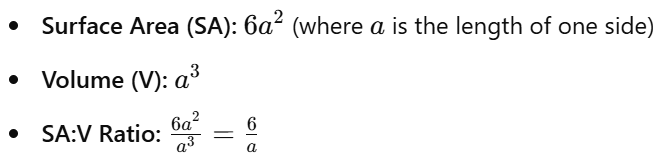
Cube:
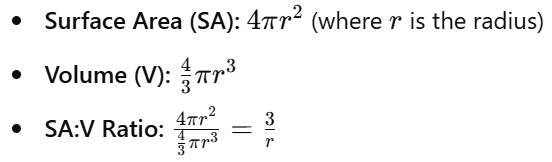
Sphere:
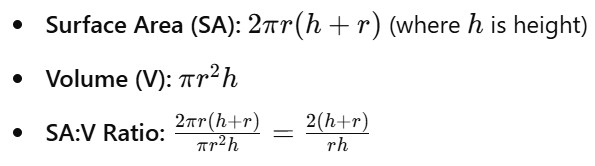
Cylinder:
Key Points
- Smaller cells have higher SA:V ratios, facilitating efficient nutrient uptake and waste removal.
- As cells grow, SA:V ratio decreases, potentially limiting diffusion efficiency.
8. Effect of SA:V Ratio on Diffusion Using Agar Blocks
8.1 Experiment Overview
- Objective: Investigate how different SA:V ratios affect the rate of diffusion.
- Materials: Agar blocks of varying sizes/shapes, colored dyes.
8.2 Procedure
- Prepare agar blocks with embedded dye.
- Place agar blocks of different sizes/shapes in identical dye solutions.
- Measure the rate at which dye diffuses into the agar blocks over time.
8.3 Expected Results
- Agar blocks with higher SA:V ratios (smaller or flatter shapes) will show faster diffusion rates.
- Larger blocks with lower SA:V ratios will have slower diffusion rates.
8.4 Conclusion
- Demonstrates that SA:V ratio significantly impacts the rate of diffusion, with higher ratios enhancing diffusion efficiency.
9. Effects of Different Water Potentials on Plant Tissues
9.1 Understanding Water Potential
- Water Potential (Ψ): A measure of the potential energy of water in a system; determines the direction of water movement.
- Formula: Ψ=Ψs+Ψp
- Ψs: Solute potential (negative value, decreases as solute concentration increases)
- Ψp: Pressure potential (positive value in turgid cells)
9.2 Experiment: Immersing Plant Tissues in Solutions
- Setup: Place plant tissues (e.g., potato slices) in solutions of varying concentrations.
Observations:
- Hypotonic Solution (higher water potential): Water enters cells, causing them to become turgid.
- Isotonic Solution (equal water potential): No net movement of water; cells remain unchanged.
- Hypertonic Solution (lower water potential): Water exits cells, causing plasmolysis.
- Estimation of Water Potential: Compare the responses of plant tissues to determine their inherent water potential.
Key Points
- Water moves from areas of higher to lower water potential.
- Turgid plant cells are a result of water entering cells in hypotonic solutions.
- Plasmolyzed plant cells result from water exiting cells in hypertonic solutions.
10. Movement of Water Between Cells and Solutions
10.1 Water Movement in Terms of Water Potential
- Direction: From regions of higher water potential to lower water potential.
- Equilibrium: Water moves until water potential is equal on both sides of the membrane.
10.2 Effects on Plant Cells vs. Animal Cells
Plant Cells:
- Turgid State: In a hypotonic environment, water enters, and the cell becomes turgid, providing structural support.
- Plasmolyzed State: In a hypertonic environment, water exits, causing the cell membrane to pull away from the cell wall.
- No Lysis: Cell walls prevent bursting even in hypotonic conditions.
Animal Cells:
- In a Hypotonic Environment: Water enters, potentially causing cells to swell and burst (lysis) as there is no cell wall to provide support.
- In a Hypertonic Environment: Water exits, causing cells to shrink (crenation).
- Isotonic Environment: Cells maintain their normal shape and function.
Key Points
- Plant Cells: Benefit from a rigid cell wall that accommodates changes in water content without bursting.
- Animal Cells: Lack a cell wall, making them more susceptible to damage from osmotic imbalances.
- Importance of Water Potential: Critical in understanding how cells interact with their environment and maintain homeostasis.
11. Mathematical Requirements for Surface Area and Volume
- Ensure proficiency in calculating surface area and volume for common 3-D shapes as these skills are essential for understanding SA:V ratios.
Common Formulas:

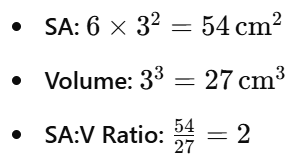
Example Calculation:
Cube with side 3 cm:
12. Water Potential
Definition
- Water Potential (Ψ): A measure of the potential energy in water, influencing the direction water will flow. It determines the movement of water from regions of higher water potential to lower water potential.
Key Points
- Pure Water: Has the highest water potential, set as Ψ = 0.
Factors Affecting Water Potential:
- Solute Concentration: Adding solutes lowers water potential.
- Pressure: Physical pressure can influence water potential, but detailed knowledge of solute and pressure potentials is not required here.
13. Types of Solutions Based on Water Potential
a. Hypotonic Solution
- Definition: Solution with higher water potential than the plant tissue.
- Effect on Plant Cells:
- Water Movement: Into the cells.
- Outcome: Cells become turgid (firm and swollen).
- Example: Distilled water is typically hypotonic relative to plant cells.
b. Hypertonic Solution
- Definition: Solution with lower water potential than the plant tissue.
- Effect on Plant Cells:
- Water Movement: Out of the cells.
- Outcome: Cells undergo plasmolysis (cell membrane pulls away from the cell wall).
- Example: Salt or sugar solutions are hypertonic relative to plant cells.
c. Isotonic Solution
- Definition: Solution with equal water potential to the plant tissue.
Effect on Plant Cells:
- Water Movement: No net movement of water.
- Outcome: Cells remain unchanged.
- Example: 0.9% NaCl solution is isotonic to many plant cells.
14. Investigating Water Potential of Plant Tissues
Experimental Approach
- Immerse Plant Tissues (e.g., leaf discs, potato slices) in solutions of varying concentrations.
Observe Effects:
- Turgidity: Indicates a hypotonic environment.
- Plasmolysis: Indicates a hypertonic environment.
- No Change: Indicates an isotonic environment.
Estimate Water Potential:
- Identify the solution where plant tissues show no net movement (isotonic point).
- The water potential of the plant tissue is approximately equal to that of the isotonic solution.
15. Movement of Water Between Cells and Solutions
Conceptual Understanding
- Direction of Movement: Water moves from areas of higher water potential to lower water potential.
Plant vs. Animal Cells:
- Plant Cells: Surrounded by a rigid cell wall, influencing how they respond to water movement.
- Animal Cells: Lack a cell wall, making them respond differently to water movement.
16. Effects of Water Movement on Plant and Animal Cells
a. Plant Cells
- Hypotonic Solution:
- Effect: Water enters the cell.
- Outcome: Turgidity – cell becomes firm and swollen.
- Hypertonic Solution:
- Effect: Water exits the cell.
- Outcome: Plasmolysis – cell membrane pulls away from the cell wall.
- Isotonic Solution:
- Effect: No net movement of water.
- Outcome: Cell remains unchanged.
b. Animal Cells
Hypotonic Solution:
- Effect: Water enters the cell.
- Outcome: Lysis (bursting) due to lack of a rigid cell wall.
Hypertonic Solution:
- Effect: Water exits the cell.
- Outcome: Crenation – cell shrivels.
Isotonic Solution:
- Effect: No net movement of water.
- Outcome: Cell remains unchanged.
Practice Questions
1. How Do Simple Diffusion, Facilitated Diffusion, Osmosis, Active Transport, Endocytosis, and Exocytosis Occur?
Answer:
Simple Diffusion
- Process: Passive movement of small, non-polar molecules from high to low concentration directly across the phospholipid bilayer.
Facilitated Diffusion
Carrier Proteins: Change shape to move molecules across.
Process: Passive movement of molecules via specific transport proteins.
Mechanisms:
Channel Proteins: Allow ions or water to pass through.
Osmosis
Process: Movement of water molecules through a semi-permeable membrane from a region of higher to lower water potential.
Active Transport
Mechanism: Utilizes carrier proteins acting as pumps.
Process: Movement of substances against their concentration gradient using energy (ATP).
Endocytosis
Pinocytosis: Ingestion of fluids.
Process: Cell membrane engulfs material, forming a vesicle inside the cell.
Types:
Phagocytosis: Ingestion of large particles.
Exocytosis
Process: Vesicles fuse with the cell membrane to release contents outside the cell.
2. How Can We Investigate Simple Diffusion and Osmosis Using Plant Tissue and Non-Living Materials?
Answer:
Using Plant Tissue
Observe changes in mass or length to study osmosis.
Method:
Place plant cells (e.g., potato slices) in various solutions.
Using Dialysis (Visking) Tubing
Immerse in water and observe the movement of substances.
Method:
Fill tubing with a solution.
Using Agar
Measure the rate of diffusion of substances into the agar.
Method:
Use agar blocks infused with an indicator.
3. How Does Surface Area to Volume Ratio Affect Diffusion, and How Is It Calculated?
Answer:
Principle
SA Ratio Decreases with Increasing Size:
Smaller cells have a higher SA ratio, enhancing diffusion efficiency.
Calculations
For Simple 3-D Shapes:
- Surface Area (SA): Sum of all external surfaces.
- Volume (V): Space occupied by the object.
- SA Ratio: SA divided by V.
4. How Can We Investigate the Effect of Changing Surface Area to Volume Ratio on Diffusion?
Method
Using Agar Blocks:
- Cut agar into different sizes.
- Immerse in a diffusing substance.
- Measure how far the substance diffuses into each block.
Observation
Smaller blocks (higher SA ratio) show faster and more efficient diffusion.
5. How Do We Investigate the Effects of Immersing Plant Tissues in Solutions of Different Water Potentials to Estimate the Water Potential of the Tissues?
Answer:
Method
Prepare Solutions: With varying known water potentials.
Procedure:
Place plant tissues in each solution.
Record changes in mass after a set time.
Analysis
Graphing Results:
Plot percentage change in mass against the water potential of the solutions.
Estimating Water Potential:
Identify the point where there is no net change in mass.
6. How Does Water Move Between Cells and Solutions, and What Are Its Effects on Plant and Animal Cells?
Answer:
Water Movement in Terms of Water Potential
Water moves from regions of higher water potential to lower water potential.
Effects on Plant Cells
In Hypotonic Solutions:
Water enters the cell.
Cell becomes turgid but does not burst due to the cell wall.
In Hypertonic Solutions:
Water leaves the cell.
Cell undergoes plasmolysis (membrane pulls away from the wall).
Effects on Animal Cells
Cell shrinks (crenation).
In Hypotonic Solutions:
Water enters the cell.
Cell may burst (lyse) due to lack of a cell wall.
In Hypertonic Solutions:
Water leaves the cell.