P.16 Chapter Summary
Experimental Design, Data Handling, and Biological Drawings
This guide covers three major areas:
- Experimental Design and Variables
- Data Handling and Calculations
- Biological Drawings and Illustrations
Each section is broken down into key concepts, guidelines, and practical tips to ensure that your experimental work is accurate, well-documented, and clearly presented.
1. Experimental Design and Variables
Experimental Variables
- Independent Variable:
The variable that you deliberately change to observe its effect.
Example: In an enzyme experiment, altering the concentration of the enzyme solution. - Dependent Variable:
The variable that is measured or observed in response to changes in the independent variable.
Example: Reaction rate or the time taken to reach an endpoint in enzyme reactions. - Standardised Variables:
All other variables that could affect the dependent variable, which must be kept constant.
Example: Maintaining constant temperature and pH in enzyme experiments.
Tools for Controlling Variables
- Temperature:
Use a water bath—preferably one with thermostatic control to maintain stable conditions. - pH:
Use buffer solutions to ensure that the pH remains constant throughout the experiment.
Range and Interval
- Range:
The spread of values for the independent variable from the lowest to the highest. - Interval:
The difference between successive values within that range.
2. Data Handling and Calculations
Accuracy, Precision, and Replicates
- Accuracy:
How close a measurement is to the true value.
Example: A measuring cylinder accurately reading 50 cm³ when it contains exactly 50 cm³. - Precision:
The consistency of repeated measurements regardless of their accuracy. - Replicates:
Performing multiple trials and calculating the mean value to reduce random errors and enhance reliability.
Constructing Results Tables
- Format:
- Place the independent variable in the first column.
- List dependent variable readings in subsequent columns.
- Units:
Include units in the column headings rather than in individual cells. - Consistency:
Record all values to the same number of decimal places, including calculated means.
Graphs: Line Graphs, Bar Charts, and Histograms
- Line Graphs:
- Axes:
- X-axis: Independent variable (e.g., enzyme concentration).
- Y-axis: Dependent variable (e.g., reaction time).
- Labels & Units:
Clearly label axes with SI units. - Scales:
Use even, logical intervals to cover the data range. - Plotting:
Represent data points with small crosses or encircled dots and draw a best-fit line that does not extrapolate beyond your data.
- Axes:
- Bar Charts:
- Usage:
Ideal for categorical (discontinuous) data where each bar represents a distinct category. - Design:
Bars are separated by gaps to emphasize that the categories do not form a continuum.
- Usage:
- Histograms:
- Usage:
Best for displaying the frequency distribution of continuous data. - Design:
Bars touch one another to reflect the continuity of the data.
- Usage:
Calculations in Experiments
- Mean Calculation:
- Purpose: To find the average value from a set of measurements.
- Steps:
- Sum all measurements.
- Divide by the number of measurements.
- Example:
Given readings: 12.5 µm, 18.6 µm, 13.2 µm, 10.8 µm, 11.3 µm
Mean = (12.5 + 18.6 + 13.2 + 10.8 + 11.3) / 5 = 13.3 µm
Ensure the mean is presented with the same precision as the original data.
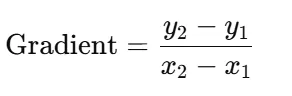
- Gradient Calculation:
- Straight Line:
Choose two well-spaced points and apply:
- Straight Line:
- Curved Line:
Draw a tangent at the point of interest and calculate the gradient along the tangent. - Percentage Change:
- Formula:
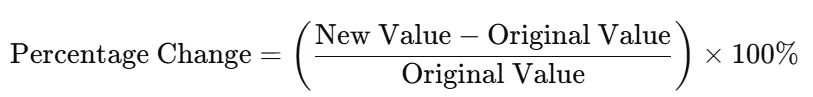
- Example:
Initial mass = 250 g, Final mass = 221 g
Change = 250 – 221 = 29 g; Percentage Change = (29/250) × 100 ≈ 11.6%
3. Writing Conclusions and Data Interpretation
Writing Conclusions
- Direct and Clear:
Answer the experimental question using observed data trends. - Data-Driven:
Base conclusions strictly on the collected data without introducing external assumptions. - Avoid Overinterpretation:
Keep conclusions concise and do not extrapolate beyond what the data indicates.
Describing Data from Graphs
- Overall Trend:
Start by summarizing the general relationship between the independent and dependent variables. Example: “As enzyme concentration increases, the reaction rate increases.” - Gradient Changes:
Describe any noticeable shifts in the gradient, which indicate changes in the rate of change. - Quoting Data Points:
Provide specific x and y values from key points on the graph to support your interpretation. - Avoid Time-Based Language:
Use precise descriptions that focus on the variables represented (avoid words like “faster” unless time is the variable on an axis).
4. Identifying Sources of Error and Suggesting Improvements
Types of Errors
- Systematic Errors:
Consistent inaccuracies (e.g., a miscalibrated thermometer that always reads 1°C too high).
Effect: Impacts absolute values but not trends. - Random Errors:
Unpredictable variations (e.g., fluctuations in water bath temperature or subjective end-point judgments).
Effect: May obscure true trends and affect data precision.
Suggestions for Improvement
- Enhanced Measurement Precision:
Use more accurate instruments (e.g., digital thermometers and graduated pipettes). - Objective Data Collection:
Employ devices like colorimeters to reduce human error. - Better Environmental Control:
Use thermostatically controlled water baths and pH buffers. - Replication:
Increase the number of replicates and calculate mean values to improve data reliability.
5. Biological Drawings
General Guidelines
- Line Quality:
Use clear, single lines with an HB pencil—avoid shading or coloring. - Proportions and Scale:
Accurately represent relative sizes and use an eyepiece graticule for precise measurements. - Draw What You See:
Record only the observed details from the specimen without assumptions.
Types of Biological Drawings
- Low-Power Plan (Plan Diagram):
Depicts the overall layout of tissues without detailing individual cells. Ideal for visualizing tissue organization and boundaries. - High-Power Detail:
Focuses on individual cells and their internal structures. For plant cells, draw two lines for cell walls, using three where cells meet to depict shared walls.
Labeling and Measurements
- Label Lines:
Use a ruler to draw straight lines for labels, ensuring they do not cross or clutter the drawing. - Text Orientation:
Write labels horizontally and place them outside the drawing area. - Magnification Calculation:
If required, calculate magnification and use an eyepiece graticule calibrated with a stage micrometer for precise measurements.
6. Detailed Study Notes for Answering Key Experiment Questions
1. Collect Data and Observations
- Approach:
Collect data systematically, noting each measurement and observation (e.g., changes in color, formation of precipitate, reaction times). - Notes:
Use standardized methods and consistent intervals. Record all relevant observations, including any unexpected events.
2. Make Decisions About Measurements and Observations
- Approach:
Decide on the type and frequency of measurements. Choose the appropriate instruments (e.g., pipettes, digital thermometers). - Notes:
Identify your independent, dependent, and standardised variables. Define a range and interval for the independent variable.
3. Record Data and Observations Appropriately
- Approach:
Use structured tables with clear headings and units. Record all values to the same decimal precision. - Notes:
Include replicates and calculate means. Note any anomalous results.
4. Display Calculations and Reasoning Clearly
- Approach:
Show all calculation steps (e.g., mean, gradient, percentage change) using appropriate formulas and consistent units. - Notes:
Ensure your reasoning is transparent and each step is clearly documented.
5. Use Tables and Graphs to Display Data
- Approach:
Use tables for structured data and graphs to visualize trends. Choose the appropriate graph type (line graph, bar chart, histogram) based on your data. - Notes:
Label axes with units and ensure even scale intervals. Plot data points accurately.
6. Interpret Data and Observations
- Approach:
Identify trends and patterns (e.g., increasing enzyme concentration leads to faster reaction rates). Support interpretations with specific data points. - Notes:
Describe changes in gradient and avoid time-related language unless appropriate.
7. Draw Conclusions
- Approach:
Summarize key findings and answer the experimental question directly. Keep conclusions concise and strictly based on the data. - Notes:
Use data trends to support your conclusions without introducing new information.
8. Identify Significant Sources of Error
- Approach:
Distinguish between systematic and random errors. Identify any equipment or procedural limitations. - Notes:
Provide examples (e.g., miscalibrated thermometer, water bath fluctuations) and note how these might affect your results.
9. Suggest Improvements or Extensions
- Approach:
Recommend practical improvements (e.g., better instruments, more replicates, stricter environmental controls) to enhance accuracy and reliability. - Notes:
Suggest further investigations that could expand on your current study (e.g., testing additional variables).