P.08 Recording Quantitative Results
Key Points for Constructing a Results Table
1. Clear, Ruled Structure
- Organized Layout:
Use clear, ruled lines to separate rows and columns. This structure helps the reader quickly interpret and compare data. - Borders:
Draw a border around the table to encapsulate the data and enhance overall clarity.
2. Headings and Units
- Column/Row Headings:
Clearly label each column or row with the quantity being measured (e.g., “Rennin Concentration (%)” or “Time to Reach End-Point (s)”). - Units in Headings:
Always include SI units within the headings to avoid clutter in the data cells and to maintain consistency.
3. Order and Sequence
- Independent Variable First:
List the independent variable (e.g., rennin concentration) as the first column. Arrange its values in a logical order (typically from lowest to highest) to show progression. - Dependent Variable Columns:
Follow with one or more columns for the dependent variable(s) (e.g., multiple readings of the reaction time).
4. Consistency in Decimal Places
- Uniform Decimal Places:
Record all measurements with the same number of decimal places to reflect the precision of your measurement tools. - Mean Values:
When calculating averages from replicates, express the result with the same precision as the individual data points.
5. Handling Anomalous Results
- Identifying Outliers:
Clearly mark anomalous results (e.g., using bold italics or a specific note) to differentiate them from typical data. - Excluding Anomalies:
If an outlier cannot be re-measured, consider excluding it from the mean calculation to prevent skewing the data.
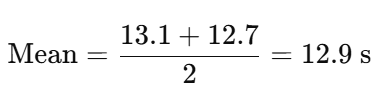
Example: If one reading at 1.0% concentration is anomalous (e.g., 18.9 s) and the other two readings are 13.1 s and 12.7 s, calculate the mean using only the consistent values:
6. Recording Non-Results
- Documenting No Reaction:
Clearly indicate when no measurable reaction occurs (e.g., “did not clot”). - Calculating Rates:
For derived calculations such as reaction rates (e.g., 1/time), use special notation. For instance, if no reaction occurs (i.e., time is infinite), record the rate as 0 (since 1/∞=0).
7. Example of a Well-Organized Results Table
Below is an example table summarizing data from a rennin experiment:
| Rennin Concentration (%) | Time to Reach End-Point (s) – 1st Reading | Time to Reach End-Point (s) – 2nd Reading | Time to Reach End-Point (s) – 3rd Reading | Mean Time (s) |
|---|---|---|---|---|
| 0.0 | did not clot | did not clot | did not clot | did not clot |
| 0.2 | 67.2 | 68.9 | 67.8 | 67.96 |
| 0.4 | 48.1 | 46.9 | 47.3 | 47.1 |
| 0.6 | 30.1 | 31.9 | 30.1 | 30.7 |
| 0.8 | 20.3 | 19.2 | 19.9 | 19.8 |
| 1.0 | 13.1 | 13.1 | 18.9 (anomalous) | 12.9 |
Note: In the 1.0% concentration row, the anomalous result (18.9 s) is highlighted and excluded from the mean calculation.
8. Summary Tips for Accurate Data Recording
- Document Non-Results:
Clearly mark instances where the expected reaction does not occur so that derived calculations accurately reflect these cases. - Design Clear Tables:
An organized and neat table facilitates easier data interpretation and subsequent graphing or statistical analysis. - Consistency is Key:
Maintain uniform decimal places and consistent units across all measurements for clarity and precision. - Handle Anomalies Carefully:
Identify and document outliers. If needed, exclude these from statistical analyses to ensure that the overall data remains representative.