8.09 Electrical Conduction System of the Heart
Properties of Cardiac Muscle
Myogenic Nature
- Definition:
- Myogenic: Cardiac muscle can contract and relax independently of external nerve impulses.
- Characteristics:
- Autonomous Contraction: In a nutrient-rich, oxygenated environment, isolated cardiac muscle cells will beat rhythmically on their own.
- Synchronization Purpose:
- Ensures that all heart muscle cells contract in unison, maintaining effective pumping action.
- Prevents individual contractions that could disrupt the coordinated flow of blood.

Heart’s Built-In Control System
- Function:
- Coordination: Ensures organized and coordinated contractions across heart muscle cells.
- Prevention of Asynchronous Beats: Maintains a steady and effective rhythm, preventing impaired blood flow.
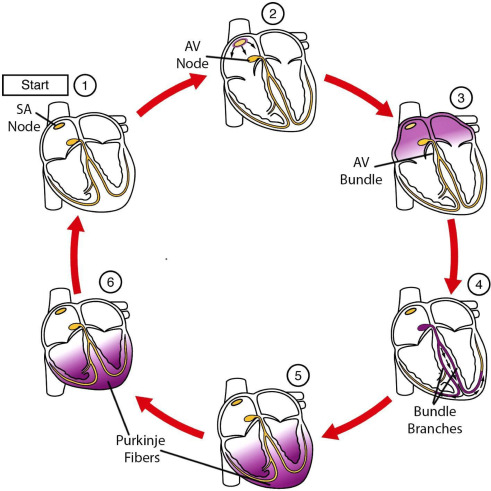
Electrical Conduction System of the Heart
- The heart’s ability to contract rhythmically and efficiently is governed by its electrical conduction system, which ensures that contractions occur in a coordinated manner.
Sinoatrial Node (SAN) – Pacemaker of the Heart
- Location:
- Situated in the wall of the right atrium.
- Function:
- Initiates Heart Rhythm: Acts as the natural pacemaker, setting the pace for the heart’s contractions.
- Action Mechanism:
- Automaticity: SAN muscle cells have the inherent ability to contract spontaneously at a faster rate than other cardiac cells.
- Excitation Wave: Each SAN contraction generates an electrical impulse that spreads across both atrial walls, causing the atria to contract simultaneously.


Atrioventricular Node (AVN) – Secondary Conductor with Delay
- Location:
- Found in the septum between the atria and ventricles.
- Function:
- Signal Delay: Delays the electrical impulse by approximately 0.1 seconds.
- Role:
- Coordination: Allows atria to fully contract and empty blood into the ventricles before ventricular contraction begins.
- Exclusive Pathway: Serves as the only conductive pathway between atria and ventricles due to the insulating fibrous layer separating them.
Purkyne Tissue – Ventricular Conduction Pathway
- Location:
- Extends from the AVN through the septum to the apex of the ventricles.
- Function:
- Rapid Impulse Transmission: Conducts the electrical excitation wave swiftly through the ventricles.
- Action Mechanism:
- Ventricular Contraction: Ensures that ventricles contract from the bottom upwards, efficiently pumping blood into the arteries (aorta and pulmonary artery).
Electrocardiogram (ECG) Components and Their Significance

- An Electrocardiogram (ECG or EKG) is a diagnostic tool that records the electrical activity of the heart. It provides valuable information about heart rhythm, electrical conduction, and can indicate various cardiac conditions.

I. Basic Principles of ECG
- Electrical Activity of the Heart:
- Depolarization: Electrical activation leading to contraction (P wave, QRS complex).
- Repolarization: Electrical recovery leading to relaxation (T wave).
- ECG Waves:
- P Wave: Atrial depolarization.
- QRS Complex: Ventricular depolarization.
- T Wave: Ventricular repolarization.
- U Wave: Sometimes present; associated with repolarization of Purkinje fibers.
II. Detailed Explanation of ECG Components
A. P Wave (Atrial Depolarization)
1.Why does it go UP?
- The SA node (sinoatrial node) sends an electrical impulse that spreads through the atria, causing them to contract.
- This depolarization of the atria creates the P wave, which is normally small and positive in most leads.
- Duration: 0.08–0.12 sec
🔻 2. Why does it return DOWN to baseline?
- After atrial contraction, the atria repolarize, but this is usually hidden by the next event (QRS complex).
B. PR Interval (Time for impulse to reach ventricles)
- Description:
- Span: From the beginning of the P wave to the beginning of the QRS complex.
- Duration: 0.12 to 0.20 seconds.
- Physiological Significance:
- Conduction Time: Represents the time taken for electrical impulse to travel from atria through the AV node to ventricles.
- Normal Range: Ensures synchronized atrial and ventricular contractions.
C. QRS Complex (Ventricular Depolarization)
- Description:
- Appearance: Sharp, rapid deflection following the P wave.
- Duration: 0.06 to 0.10 seconds.
- Amplitude: Typically 1-2 mV.
- Why does it have 3 waves (Q, R, and S)?
This complex represents the spread of electrical impulses through the ventricles, which triggers ventricular contraction (systole).
It has an initial downward deflection (Q), a large upward spike (R), and a downward return (S). - 🔻 Q Wave (First Negative Deflection)
Occurs due to depolarization of the interventricular septum (left to right).
If deep and wide, it may indicate an old heart attack (MI). - 🔺 R Wave (Large Positive Deflection)
Represents massive depolarization of the left and right ventricles.
The left ventricle is thicker and contributes most to this sharp upward spike. - 🔻 S Wave (Final Negative Deflection)
Represents final depolarization of the ventricles, mainly in the basal (upper) parts of the heart. - 📏 Normal QRS duration: 0.06–0.10 sec
If prolonged (>0.12 sec) → Indicates bundle branch block (BBB) or ventricular arrhythmia.
D. ST Segment (Ventricles Contracting)
- Description:
- Span: From the end of the QRS complex to the beginning of the T wave.
- Duration: Variable, typically isoelectric.
- Physiological Significance:
- Ventricular Repolarization: Represents the period between ventricular depolarization and repolarization.
E. T Wave (Ventricular Repolarization)
- Description:
- Appearance: Smooth, rounded wave following the ST segment.
- Duration: Variable, typically 0.10 to 0.25 seconds after QRS.
- Physiological Origin:
- Ventricular Repolarization: This represents ventricular repolarization, where the heart resets for the next cycle. In other words the muscles relax.
F. U Wave
- Description:
- Appearance: Small wave following the T wave.
- Duration and Amplitude: Variable; often not prominent.
- Physiological Origin:
- Repolarization of Purkinje Fibers: Not fully understood, but associated with repolarization phases.
- Clinical Significance:
- Prominent U Waves: May indicate electrolyte imbalances (e.g., hypokalemia).
G. QT Interval (Ventricular Activity Duration)
- Description:
- Span: From the beginning of the QRS complex to the end of the T wave.
- Duration: 0.35 to 0.45 seconds.
- Physiological Significance:
- Ventricular Depolarization and Repolarization: Encompasses the entire process of ventricular electrical activity.

III. The Cardiac Cycle in ECG Terms
- Understanding the cardiac cycle phases in relation to ECG components helps in correlating electrical activity with mechanical heart functions.
A. Atrial Systole
- ECG Representation: P wave.
- Process: Atria contract, pushing blood into ventricles.
B. Ventricular Systole
- ECG Representation: QRS complex.
- Process: Ventricles contract, pumping blood into arteries.
C. Ventricular Diastole
- ECG Representation: T wave.
- Process: Ventricles relax, allowing them to fill with blood from atria.
IV. Common ECG Abnormalities and Their Indicators
A. Arrhythmias
- Atrial Fibrillation:
- ECG Features: Irregularly irregular rhythm, absence of distinct P waves.
- Ventricular Tachycardia:
- ECG Features: Wide QRS complexes, rapid heart rate.
B. Myocardial Infarction Indicators
- ST Elevation:
- Significance: Indicative of acute transmural myocardial infarction.
- Pathological Q Waves:
- Significance: Suggest previous myocardial infarction.
C. Conduction Blocks
- First-Degree AV Block:
- ECG Features: Prolonged PR interval (>0.20 seconds).
- Bundle Branch Blocks:
- ECG Features: Wide QRS complexes with characteristic patterns (e.g., RSR’ in right bundle branch block).
D. Electrolyte Imbalances
- Hyperkalemia:
- ECG Features: Tall, peaked T waves; widened QRS.
- Hypokalemia:
- ECG Features: Flattened T waves; prominent U waves.
V. Summary and Key Takeaways
A. Heart Function
- Four Chambers: Ensure efficient separation and flow of oxygenated and deoxygenated blood.
- Valves: Maintain unidirectional blood flow, preventing backflow.
- Pressure Dynamics: Drive blood through systemic and pulmonary circuits.
B. ECG Interpretation
- P Wave: Atrial depolarization; issues may indicate atrial abnormalities.
- QRS Complex: Ventricular depolarization; key for identifying ventricular issues.
- T Wave: Ventricular repolarization; alterations can signal repolarization problems.
- Intervals and Segments: Provide insights into conduction times and potential blocks.
C. Clinical Relevance
- Understanding Physiology: Facilitates the interpretation of ECG changes in various pathological states.
- Correlating ECG with Heart Function: Essential for diagnosing arrhythmias, myocardial infarctions, and conduction disorders.

Practice Questions
Question 1
Explain the myogenic nature of cardiac muscle and its significance in heart function. (5 marks)
Mark Scheme:
- Definition of Myogenic:
- Cardiac muscle is myogenic, meaning it can contract and relax independently without external nerve impulses. (1 mark)
- Autonomous Contraction:
- In a nutrient-rich, oxygenated environment, isolated cardiac muscle cells beat rhythmically on their own. (1 mark)
- Synchronization Purpose:
- Ensures that all heart muscle cells contract in unison, maintaining an effective pumping action. (1 mark)
- Prevention of Disruption:
- Prevents individual contractions that could disrupt the coordinated flow of blood. (1 mark)
- Overall Significance:
- The myogenic property ensures the heart maintains a steady rhythm and consistent blood flow, essential for proper circulation. (1 mark)
Question 2
Describe the role of the sinoatrial node (SAN) in the heart’s electrical conduction system. (5 marks)
Mark Scheme:
- Location of SAN:
- The sinoatrial node (SAN) is situated in the wall of the right atrium. (1 mark)
- Function as Pacemaker:
- Acts as the natural pacemaker of the heart, initiating the heartbeat with a myogenic rhythm. (1 mark)
- Automaticity:
- SAN muscle cells have the inherent ability to contract spontaneously, setting the pace for the heart’s contractions. (1 mark)
- Excitation Wave Generation:
- Each SAN contraction generates an electrical impulse that spreads across both atrial walls. (1 mark)
- Atrial Contraction:
- The excitation wave causes the atria to contract simultaneously, pushing blood into the ventricles. (1 mark)
Question 3
Explain the purpose of the atrioventricular node (AVN) in the cardiac conduction pathway. (5 marks)
Mark Scheme:
- Location of AVN:
- The atrioventricular node (AVN) is found in the septum between the atria and ventricles. (1 mark)
- Signal Delay Function:
- Delays the electrical impulse by approximately 0.1 seconds. (1 mark)
- Role in Coordination:
- Allows the atria to fully contract and empty blood into the ventricles before ventricular contraction begins. (1 mark)
- Exclusive Conductive Pathway:
- Serves as the only conductive pathway between the atria and ventricles due to the insulating fibrous layer separating them. (1 mark)
- Overall Purpose:
- Ensures ordered and coordinated contractions of the heart chambers, maintaining efficient blood flow. (1 mark)
Question 4
Describe the function and location of Purkyne fibers in the heart. (5 marks)
Mark Scheme:
- Location of Purkyne Fibers:
- Purkyne fibers extend from the atrioventricular node (AVN) through the septum to the apex of the ventricles. (1 mark)
- Role in Conduction Pathway:
- Conduct the electrical excitation wave rapidly through the ventricles. (1 mark)
- Rapid Impulse Transmission:
- Ensure that the electrical impulse travels swiftly throughout the ventricular muscle, facilitating coordinated contraction. (1 mark)
- Ventricular Contraction Direction:
- Cause the ventricles to contract from the bottom upwards, efficiently pumping blood into the aorta and pulmonary artery. (1 mark)
- Overall Function:
- Enable synchronized and effective pumping of blood, maintaining efficient circulation. (1 mark)
Question 5
Outline the stages of the cardiac cycle, including the roles of atrial and ventricular systole and diastole. (6 marks)
Mark Scheme:
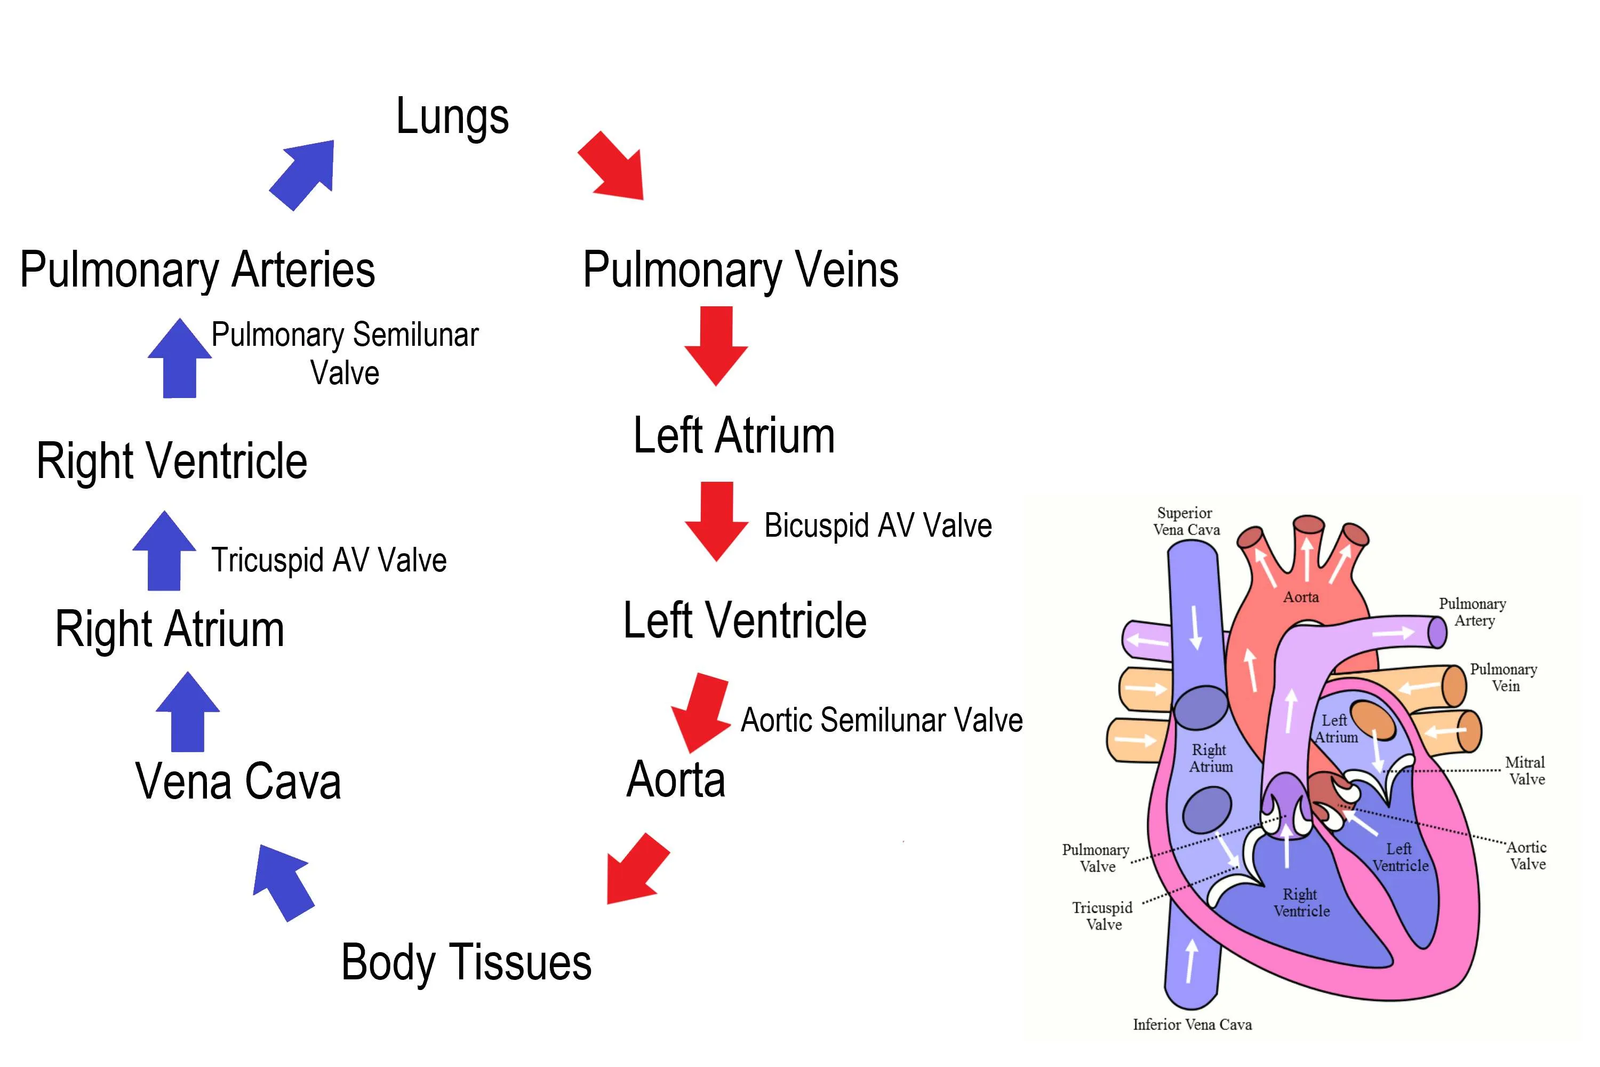
- Atrial Systole:
- Action: Atria contract, pushing blood into the ventricles through the atrioventricular (AV) valves. (1 mark)
- Mechanism: Increased atrial pressure opens the AV valves, allowing blood flow from atria to ventricles. (1 mark)
- Ventricular Systole:
- Action: Ventricles contract, pushing blood into the arteries through the semilunar valves. (1 mark)
- Mechanism: High ventricular pressure closes the AV valves to prevent backflow and opens semilunar valves, allowing blood to flow into the aorta and pulmonary artery. (1 mark)
- Diastole:
- Action: Heart muscle relaxes; ventricles and atria fill with blood from the veins. (1 mark)
- Mechanism: Low ventricular pressure opens the AV valves, allowing blood to flow from the vena cava and pulmonary veins into the atria and then into the ventricles. Semilunar valves close to prevent arterial blood from flowing back into the ventricles. (1 mark)
- Overall Sequence:
- The cycle includes atrial systole, ventricular systole, and diastole, ensuring continuous blood flow through the heart chambers and into the circulation. (1 mark)
Question 6
Explain the role of heart valves during the cardiac cycle to maintain unidirectional blood flow. (6 marks)
Mark Scheme:
- Types of Heart Valves:
- Atrioventricular (AV) Valves: Bicuspid (Mitral) Valve between the left atrium and ventricle; Tricuspid Valve between the right atrium and ventricle.
- Semilunar Valves: Aortic Valve between the left ventricle and aorta; Pulmonary Valve between the right ventricle and pulmonary artery. (1 mark)
- AV Valves Function:
- During Atrial Systole: Open to allow blood flow from atria to ventricles. (1 mark)
- During Ventricular Systole: Close to prevent blood from flowing back into the atria. (1 mark)
- Semilunar Valves Function:
- During Ventricular Systole: Open to allow blood flow from ventricles into the arteries. (1 mark)
- During Diastole: Close to prevent blood from flowing back into the ventricles from the arteries. (1 mark)
- Preventing Backflow:
- Valves ensure that blood flows only in one direction: from atria to ventricles to arteries and back through veins, maintaining efficient circulation. (1 mark)
- Supporting Structures:
- Papillary Muscles and Tendons: Stabilize the AV valves by preventing them from inverting under high ventricular pressure. (1 mark)
Question 7
Discuss how the structure of the left and right ventricles is adapted to their specific functions in the circulatory system. (6 marks)
Mark Scheme:
- Wall Thickness:
- Left Ventricle: Has the thickest muscular wall to generate the high pressure needed for systemic circulation.
- Right Ventricle: Has a thinner muscular wall as it only needs to pump blood to the lungs at lower pressure. (1 mark)
- Pump Function:
- Left Ventricle: Pumps oxygenated blood into the aorta to supply the entire body.
- Right Ventricle: Pumps deoxygenated blood into the pulmonary artery to supply the lungs. (1 mark)
- Volume Capacity:
- Left Ventricle: Smaller in volume compared to the right ventricle, focusing on high-force contractions.
- Right Ventricle: Larger in volume to accommodate more blood from the body before pumping to the lungs. (1 mark)
- Valve Structure:
- Left Ventricle: Connected to the aortic valve, which is designed to handle high-pressure blood flow.
- Right Ventricle: Connected to the pulmonary valve, suited for lower pressure blood flow. (1 mark)
- Vascular Connections:
- Left Ventricle: Connected to elastic arteries (aorta) that can absorb and smooth out the high-pressure blood flow.
- Right Ventricle: Connected to muscular arteries (pulmonary artery) that handle lower pressure. (1 mark)
- Overall Adaptation:
- The structural differences between the left and right ventricles ensure that blood is efficiently pumped to the lungs and the rest of the body according to their pressure requirements. (1 mark)
Question 8
Explain the significance of the closed blood system and the pressure gradient in the circulatory system of mammals. (6 marks)
Mark Scheme:
- Closed Blood System Definition:
- Blood circulates within a network of vessels, remaining confined and preventing blood loss. (1 mark)
- Maintaining Pressure:
- A closed system maintains consistent blood pressure, essential for the efficient transport of oxygen, nutrients, and waste products. (1 mark)
- Arteries Carry High-Pressure Blood:
- Arteries receive high-pressure blood directly from the heart, enabling rapid distribution throughout the body. (1 mark)
- Pressure Gradient Creation:
- Blood pressure decreases progressively as blood moves from arteries to arterioles, capillaries, venules, and veins, driving the flow of blood. (1 mark)
- Systemic vs. Pulmonary Pressure:
- Systemic Circulation: Operates under higher pressure to supply the entire body.
- Pulmonary Circulation: Operates under lower pressure to protect lung capillaries during gas exchange. (1 mark)
- Efficiency and Control:
- The pressure gradient ensures unidirectional flow and allows for regulation of blood flow through vasoconstriction and vasodilation in response to the body’s needs. (1 mark)
Question 9
Describe how the haemoglobin dissociation curve illustrates the relationship between oxygen partial pressure and haemoglobin saturation. (6 marks)
Mark Scheme:
- S-Shaped Curve:
- The haemoglobin dissociation curve is S-shaped (sigmoidal), indicating cooperative binding of oxygen. (1 mark)
- Low Oxygen Partial Pressure:
- At low pO₂ (e.g., in tissues), haemoglobin has low saturation, releasing oxygen where it is needed. (1 mark)
- High Oxygen Partial Pressure:
- At high pO₂ (e.g., in lungs), haemoglobin approaches full saturation (95-97%), effectively binding oxygen. (1 mark)
- Cooperative Binding:
- Binding of one O₂ molecule changes haemoglobin’s shape, making it easier for subsequent O₂ molecules to bind, resulting in the steep rise in the curve. (1 mark)
- Bohr Shift Explanation:
- Under high CO₂ levels and low pH, the curve shifts right, reducing haemoglobin’s affinity for O₂ and promoting oxygen release in active tissues. (1 mark)
- Significance of the Curve:
- The dissociation curve illustrates how haemoglobin efficiently binds oxygen in the lungs and releases oxygen in tissues, ensuring effective gas transport. (1 mark)
Question 10
Explain the role of the Bohr shift in oxygen delivery to active tissues. (5 marks)
Mark Scheme:
- Definition of Bohr Shift:
- The Bohr shift refers to the rightward shift of the haemoglobin dissociation curve under conditions of high CO₂ and low pH. (1 mark)
- Influence of CO₂:
- High CO₂ levels in active tissues lead to an increase in H⁺ ions (lower pH), which bind to haemoglobin, causing a conformational change. (1 mark)
- Effect on Haemoglobin Affinity:
- The conformational change reduces haemoglobin’s affinity for oxygen, making it easier to release O₂ in tissues where it is most needed. (1 mark)
- Enhanced Oxygen Delivery:
- Facilitates the release of oxygen in CO₂-rich, metabolically active tissues (e.g., muscles during exercise), ensuring adequate oxygen supply for aerobic respiration. (1 mark)
- Physiological Significance:
- The Bohr shift enhances oxygen unloading in areas with high metabolic activity, thereby optimizing oxygen delivery based on the body’s dynamic needs. (1 mark)