18.10 End of Chapter Questions
Question 1 -3
1. Biodiversity includes: [1]
A ecosystem and habitat diversity
B species diversity and ecosystem diversity
C species diversity, genetic diversity and ecosystem diversity
D species diversity only
C;
2. Which of the following is the definition of the term niche? [1]
A all the environmental factors that determine where an organism lives
B all the food webs in an ecosystem
C the place where an organism lives
D the role that a species fulfills in a community
D;
3. Which of the statements about Protoctista are correct? [1]
1 A eukaryote that is not a fungus, plant or animal is a protoctist.
2 An organism with cellulose cell walls and chloroplasts may be a protoctist.
3 An organism existing as a group of similar cells may be a protoctist.
4 A single-celled heterotrophic eukaryote is a protoctist.
A 1, 2, 3 and 4
B 1, 2 and 4
C 2 and 3
D 3 and 4 only
A;
Question 4
Some students investigated what size of quadrat they should use to assess the abundance of plant species in an old field ecosystem. They used quadrats of side 10, 25, 50, 75 and 100 cm and recorded how many plant species were present. They repeated their investigation five times and calculated mean numbers of species per quadrat.
Their results are in the graph below.

a. Calculate the area of each quadrat that they used. [2]
| Quadrat of side / cm | Area / cm2 |
| 10 | 100 |
| 25 | 625 |
| 50 | 2500 |
| 75 | 5625 |
| 100 | 10000 (1 m2) |
two marks if all correct, one mark if only three correct
b. Explain why the students took five results for each quadrat. [2]
to collect reliable results;
to calculate a mean;
to see how much variation there is in the number of species per quadrat;
so they could calculate standard deviation / put range bars on their graph (showing maximum and minimum readings for each
size of quadrat / put error bars on the graph;
c. Based on their results, the students decided to use the 50 cm quadrat to study the old field. Why did they choose the 50 cm quadrat? [2]
the 50 cm quadrat includes most of the species present in the habitat;
if the quadrat was larger there would be many more individuals to count (which would take longer);
if the quadrat was smaller some of the species might not be counted each time a sample is taken;
comparative ref to the data, e.g. mean number of 6 for quadrat of size 50 cm, but 7 for 100 cm;
d. Explain how they would use the 50 cm quadrat to estimate the abundance of the diff erent plant species in the field. [3]
as the field is likely to be a uniform habitat, quadrats are placed randomly;
mark out a grid using tapes and take random numbers to find coordinates across the grid to place the quadrat;
either
record presence / absence of species (for frequency);
or
record number of species and calculate species density;
or
record percentage cover (for those species it is difficult to count);
Question 5
Five 0.25 m2 quadrats were placed randomly in an area of grassland in the UK. The percentage of each quadrat occupied by each species of plant was estimated to the nearest 5% and recorded in the following table.

a. Calculate the mean percentage cover for the first two species in the table. [1]
44 and 36;
b. Explain why the percentage cover for all the species in each quadrat adds up to more than 100%. [1]
one plant may overlie another, so both would be included in the cover for the quadrat.
c. Suggest why the percentage cover was recorded to the nearest 5%. [1]
it is difficult to estimate the percentage cover with any more precision than this.
d. Could these results be used to obtain a valid estimate of the species density for each species?
Explain your answer. [4]
these results cannot be used to estimate species frequency;
there may have been plants present that did not cover 5% of a quadrat;
there could be cowslips in all the quadrats but only in number 4 were there enough to cover an area that could be rounded up to
5% (e.g. 2.6% is the smallest area that can be rounded up to 5%);
they would give an underestimate of species frequency for small plants;
five quadrats is a small sample;
results are, unreliable / not representative, of the whole area;
e. State four factors that influence plant biodiversity in a field ecosystem. [4]
Any four of the following
climate;
soil type / soil depth / soil fertility;
temperature, qualified; e.g. by minimum / maximum / mean annual / AW
drainage / rainfall / irrigation / water supply;
grazing / predation (by primary consumers / herbivores);
availability of light / shading;
parasites / pests;
presence or absence of symbionts in the ecosystem (e.g. fungi and bacteria that live in mutualism with many plants);
application of, herbicides / fertilisers / other named agricultural chemical;
type / frequency, of cultivation;
Question 6
A sample of 39 ground beetles was captured from an area of waste ground measuring 100 × 25 metres.
Each animal was marked and then released. A second sample of 35 was caught on the following day.
Of these, 20 had been marked.
a. Use these results to estimate the number of ground beetles in the population. Show your working. [2]
(39 × 35)/20 × 100;
68;
b. State three assumptions that must be made in order to make this estimate. [3]
the marking must, not harm the animal / be non-toxic;
the marking must not influence the animal’s behaviour;
the marking must not put animals at greater risk of predation;
animals must mix at random after release;
there is no, immigration into the waste ground / emigration from the waste ground;
no ‘birth’ of beetles or death between the two sampling times;
c. Describe a method that you could use to check that the mark–release–recapture method gives a valid estimate of the ground beetle population in the area of waste ground. [4]
One way to do this is by random sampling with quadrats generate random numbers to give coordinates for positioning quadrats;
put 10 (or more) quadrats on the field;
leave for several hours;
(because putting down the quadrats may have disturbed the animals) on return move the rice plants gently to disturb the planthoppers and count them;
calculate the mean number per quadrat;
calculate an estimate of the number of planthoppers in the field by dividing the area of the field by the area of the quadrat and
multiplying the answer by the mean number of planthoppers per quadrat;
Question 7
Light is an important abiotic factor that determines the distribution and abundance of plants. Some plants are adapted to grow in areas of low light intensity. They are known as shade plants. Some students investigated the abundance of dog’s mercury, Mercurialis perennis, under forest trees in eight different locations. At each location, they used ten randomly positioned quadrats to measure the percentage cover
of this shade plant.
| Location | Light intensity at ground level / percentage of full sun | Mean percentage cover of M. perennis |
| A | 90 | 10 |
| B | 50 | 65 |
| C | 30 | 90 |
| D | 20 | 80 |
| E | 80 | 34 |
| F | 88 | 20 |
| G | 93 | 10 |
| H | 100 | 0 |
a. Draw a scatter graph to see if there is a correlation between light intensity beneath the canopy and abundance of M. perennis. [2]

axes labelled – percentage cover and light
intensity / percentage of maximum;
points plotted accurately;
b. State a null hypothesis for this investigation. [1]
null hypothesis – there is no relationship between the light intensity and the percentage cover of M. perennis.
c. Use the data in the table to calculate the Spearman rank correlation, rs. Show all your working. [4]


ranks stated correctly;
ΣD2 calculated correctly;
correct numbers substituted into the equation;
value of rs = –0.958 (or –0.96);
d. What can you conclude from your calculation? You will need to consult Table P2.8 on page 504 to help you answer this question. [3].

correlation coefficient is –0.958;
there is a negative correlation between light intensity and percentage cover of M. perennis;
the critical value for 8 samples is 0.758, the value of rs is greater than the critical value so the null hypothesis is rejected;
Question 8
Stoneflies, Plecoptera spp., lay eggs in freshwater streams and rivers. The eggs hatch into nymphs which live in the water for several years before changing to adults. Stonefly nymphs are known as good indicators of pollution since they are very sensitive to a decrease in the oxygen concentration of the water.
A biologist wanted to find out whether stonefly nymphs would be suitable as an indicator of water hardness.
She collected samples from 12 streams and obtained values of calcium carbonate concentration from the local water authority. The number of stonefly nymphs and the concentration of calcium carbonate for each of the 12 streams are in the table below.

a. Draw a scatter graph to see if there is a correlation between the number of stonefly nymphs and the hardness of the water. [2]
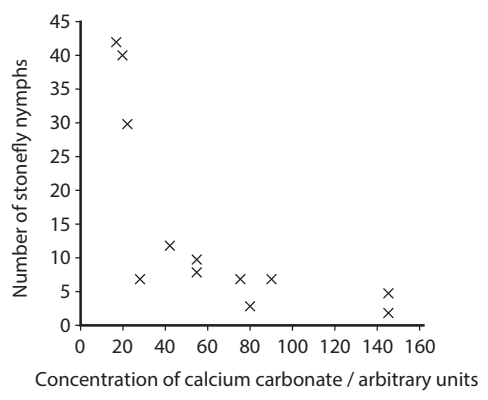
axes labelled – concentration of calcium carbonate / arbitrary units and numbers of stoneflies;
points plotted accurately;
b. State a null hypothesis for this investigation. [1]
there is no relationship between water hardness and numbers of stonefly nymphs.
c. Use the data in the table to calculate the Spearman’s rank correlation, rs. Show your working. [4]


ranks stated correctly;
ΣD2 calculated correctly;
correct numbers substituted into the equation value of rs = –0.874 (or –0.87);
d. What can you conclude from your calculation? You will need to consult Table P2.8 on page 504 to help you answer this question. [3].
correlation coefficient is –0.874;
there is a negative correlation between water hardness and numbers of stonefly nymphs;
the critical value for 12 samples is 0.544, the value of rs is greater than the critical value so the null hypothesis is rejected;
(ignore the minus sign for this step);
Question 9
Woodlice are small terrestrial crustaceans that feed on organic matter in leaf litter and in the soil.
While carrying out an ecological survey in woodland, a student noticed that there seemed to be more woodlice in areas where there was plenty of leaf litter and other organic matter. She also noticed that there appeared to be more leaf litter towards the middle of the wood than at the edge. To find out if there is a relationship between the number of woodlice and the organic content of the soil, she used a line transect. At each point along the transect, she:
• took a sample of soil.
• counted the number of woodlice in three separate samples of leaf litter from the surface of the soil.
She took the samples of soil to a laboratory to find out their percentage organic content. Her results are in the table below.

a.
i Explain why the student has taken three samples of woodlice at each point along the transect. [2]
to collect reliable results;
to calculate a mean;
to see how much variation there is in the number of species per quadrat;
so she could calculate standard deviation / put range bars on her graph (showing maximum and minimum readings for
each size of quadrat / put error bars on the graph;
ii Suggest three further pieces of information you would need if you were to repeat the student’s investigation. [3]
the exact location (e.g. GPS coordinate);
the depth of the soil sample;
the method to determine the percentage of organic matter in the soil;
the method for collecting the samples of leaf litter;
AVP;
b. Draw a scatter graph to see if there is any relationship between the number of woodlice and the mass of organic matter in the soil. [2]

axes labelled – percentage organic matter and numbers of woodlice;
points plotted accurately;
c. State the null hypothesis for this investigation. [1]
there is no relationship between soil organic matter and numbers of woodlice;
d. Carry out the Spearman’s rank test on the data that you have used to draw the scatter graph. [4]
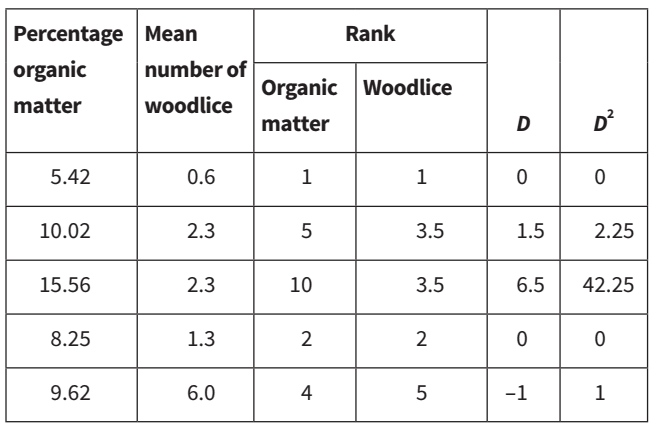


ranks stated correctly;
ΣD2 calculated correctly;
correct numbers substituted into the equation;
value of rs = 0.351 (or 0.35);
e. What conclusions can you make? You will need to consult Table P2.8 on page 504 to help you answer this question. [4]
correlation coefficient is 0.351;
there is a weak positive correlation between percentage organic content of the soil and numbers of woodlice;
the critical value for 12 samples is 0.544, this value is below the critical value so the null hypothesis is accepted;
there is no significant correlation between percentage organic content of the soil and numbers of woodlice;
Question 10
Researchers investigated aspects of the anatomy of the Melina tree, Gmelina arborea, which has been introduced into wet and dry forests in Costa Rica. The researchers wanted to know if the diameter of the trees at head height was correlated with the overall height of the trees. The table shows the data for seven trees from each type of forest.

The researchers calculated the Pearson’s correlation coefficient for the two areas as:

The critical value at p = 0.05 for samples of this size is 0.75.
a. Explain what conclusions the researchers should make from these results. [4]
the correlation coefficients for the data collected from the two samples of trees indicate that there is a weak positive
correlation between the heights of the trees and their diameters in both forests;
both correlation coefficients are lower than the critical value;
the null hypothesis would be accepted;
there is no significant correlation between the heights and the diameters;
b. Explain why the researchers chose to calculate the Pearson’s correlation coeff icient and not the Spearman’s rank correlation coeff icient. [2]
the data are quantitative data;
the data for both measurements (height and diameter) are very likely to show a normal distribution;
The researchers should check this before deciding to do the test.
c. The researchers next measured the diameters of trees of the same heights in the two forests to see if their growth in width was influenced by the rainfall in the two forests.
i State the independent and dependent variables in the investigation. [2]
independent variable = rainfall;
dependent variable = diameter of trees;
ii Describe the method that the researchers would follow to gain results. [5]
collect rainfall data from a local weather station;
choose a technique for selecting random samples of trees;
any suitable method; e.g. giving trees numbers and selecting them by using random numbers measure the, diameter / width /
circumference, of the trees;
collect results from at least 20 trees from each forest;
ensure they are approximately the same, age / height;
calculate means;
iii State how the researchers would find out if the difference between the two populations of trees is significant. [1]
use the t-test;
Question 11
Sharks are an important part of the biodiversity of marine ecosystems. Many species are endangered as a result of overfishing. In 2004, the great white shark, Carcharodon carcharias, was added to Appendix II of CITES. Two other sharks, the porbeagle, Lamna nasus, and the scalloped hammerhead shark, Sphyrna lewini, were added to Appendix III in 2013.
a. Explain what is meant by the term biodiversity. [3]
ecosystem diversity;
species diversity;
genetic diversity within species;
b.
i The great white shark is an endangered species. Explain what is meant by the term endangered. [1]
a species that is, likely to become extinct / at high risk of extinction;
ii Explain how the addition of species to the CITES lists provides protection for endangered species, such as sharks. [3]
there is a ban on trade (Appendix I);
or trade is, limited / highly regulated (Appendices II and III);
prevents species being taken from the wild (Appendix I);
reduces the number of species taken from the wild (Appendices II and III);
helps to stabilise populations; AW
so they can start to increase;
poachers / traders, are prosecuted;
c. List four practical reasons why humans should maintain biodiversity. [4].
maintains stability of ecosystems;
idea that ecosystems provide ‘services’ for humans;
ecotourism / wildlife, is a source of income for countries and source of employment;
species in the wild maybe sources of new medicines;
wild species are sources of plant foods;
wild species are sources of animal foods;
wild relatives of crop plants are a store of potential alleles for future breeding of domesticated varieties;
Question 12

The numbers of elephants in Hwange National Park in Zimbabwe were counted each year between 1980 and 2001. In the 1980s, some of the elephants were culled. This practice stopped in 1986. The graph shows the changes in the numbers of elephants (±SM), the bars indicate the numbers of elephants that were culled.

a. Explain the importance of showing the standard error (SM) on the graph. [2]
standard error is a measurement of the variation of the results about the (population) mean;
an indication of the variation in the estimates / counts that were made of the elephants;
b. Describe the changes in the numbers of elephants between 1980 and 2001. [4]
Description of pattern in the numbers:
numbers decreased to 1986;
increased to 1992;
fluctuated / AW, to 1998;
increased to 2001;
data quote; e.g. numbers of elephants for minimum of two years
c. Elephants feed by browsing on woody vegetation and other plants. They strip off bark and push over some trees, keeping patches of grassland open, but leaving much woodland.
Explain how both high and low densities of elephants could result in reduced species diversity in national parks in Africa. [4]
High density:
woodland is destroyed;
loss of habitat;
loss of any named animal(s); e.g. beetles that live in bark
Low density:
grassland lost;
tree seedlings / saplings, not trampled / eaten;
grazers, decrease in number / migrate;
less dung for, decomposers / dung beetles / fungi;
AVP;
d. Explain the reasons for culling animals, such as elephants, in national parks, other than to prevent loss of biodiversity. [4]
the number of animals is too great for the resources available;
if the numbers are not controlled there will be overgrazing; AW
not enough food for other species;
many animals will die of starvation;
not enough water;
especially in the dry season;
animals may leave the park in search of, grazing / water;
cause, damage to / loss of, crops;
AVP;
e. Populations of animals can also be controlled by the use of contraceptives.
Explain how this method is used. [4]
animals sedated;
sperm ducts cut and tied / vasectomy;
vaccinate female mammals;
inject (glyco)proteins from, layer surrounding the egg / zona pellucida;
glycoproteins are antigens;
stimulates an immune response;
female makes antibodies against her own eggs;
so prevents fertilisation;
Question 13
a. There are many seed banks in diff erent parts of the world. Explain the reasons for depositing samples of seeds in cold storage. [6]
many wild plants are endangered;
any two reasons;; e.g. climate change / deforestation / erosion / flooding / overgrazing populations of many plant species (even
those not endangered) are decreasing;
loss of genetic diversity;
seeds in seed banks can be stores of much of this genetic diversity;
can be used in the future if habitats become available for reintroductions;
plants have genes yet to be discovered that may be useful in the future;
crop plants are all genetically uniform;
could be wiped out by epidemics of plant diseases;
wild relatives of crop plants have alleles that might be useful in the future;
for plant breeding with a reason e.g. developing crops able to resist diseases / grow in different conditions (e.g. the effect of
climate change on crops);
b. Explain what is meant by the term frozen zoo. [3]
a store of sperm, eggs, embryos;
in, very cold conditions / liquid nitrogen at –196 °C;
for future breeding of endangered species;
store of embryos for rearing in surrogate mothers;
c. Przewalski’s horse, Equus ferus przewalskii, is a species of horse that became extinct in the wild in the 1980s. Zoos throughout the world already held large numbers of this species. A captive breeding programme was so successful that these horses have been returned to the Dzungarian Gobi Strictly Protected Area in Mongolia.
i Explain how captive breeding of animals, such as Przewalski’s horse, can help to conserve an endangered species. [3]
bred in several places so not all at risk from same disease;
safe from, hunting / poaching;
safe from natural catastrophes;
increases numbers of animals;
ii Explain how genetic diversity is maintained during a captive breeding programme. [3]
close relatives are not bred together;
e.g. not breeding siblings with each other / not breeding father with daughter;
sperm collected from males and stored;
transported to females in other zoos;
artificial insemination;
in-vitro fertilisation;
zoo / international organisation, keeps records of breeding;
R surrogacy
iii Suggest how the success of a reintroduction scheme may be assessed. [3]
proportion of animals that survive (for suitable length of time);
number of females that have offspring;
survival rate of offspring;
how fast the population grows;
health of the animals;
impact of reintroduction on the ecosystem;
AVP;