17.12 Chapter Summary
BioCast:
1. Phenotypic Variation
- Definition:
- Phenotypic variation refers to the observable differences in traits among individuals within a population.
Causes of Phenotypic Variation:
- Genetic Factors:
- Allelic Variation: Different versions of a gene (alleles) can lead to different traits.
Example: Blood type in humans (A, B, AB, O). - Mutation: Changes in DNA sequence can create new alleles.
Example: Sickle cell anemia resulting from a mutation in the hemoglobin gene.
- Allelic Variation: Different versions of a gene (alleles) can lead to different traits.
- Environmental Factors:
- Nutrition: Affects traits like height and weight.
Example: Malnutrition can stunt growth in children. - Climate: Influences traits such as fur density in animals.
Example: Polar bears have thick fur to adapt to cold environments. - Lifestyle and Habits: Impact traits like muscle mass.
Example: Regular exercise can increase muscle size.
- Nutrition: Affects traits like height and weight.
- Gene-Environment Interaction:
- Some traits are influenced by both genetics and environment.
Example: Human height is determined by genetic potential and nutritional status.
- Some traits are influenced by both genetics and environment.
Essential Diagrams/Figures:
- Diagram 1: Sources of Phenotypic Variation
Genetic factors, environmental factors, and their interactions.
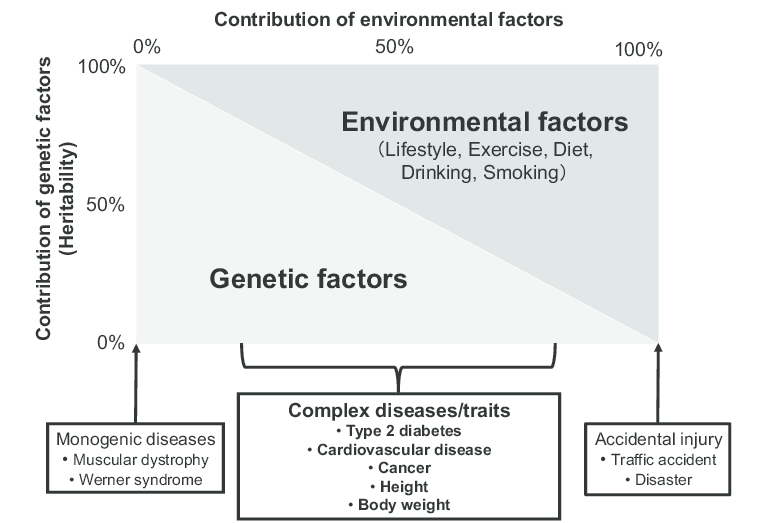
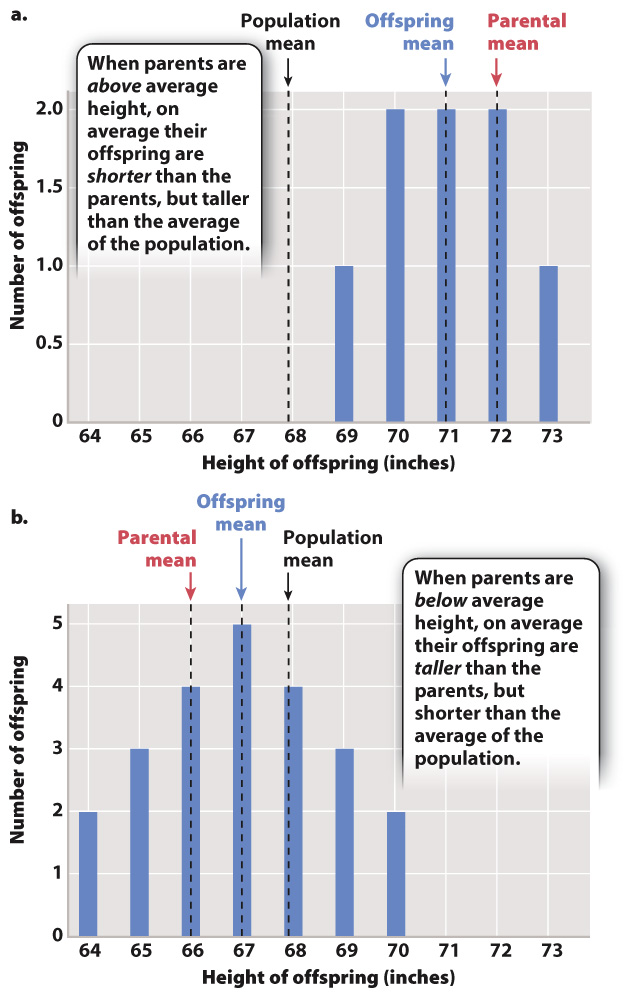
- Diagram 2: Gene-Environment Interaction Example
Genetics and environment jointly affect a trait like height.
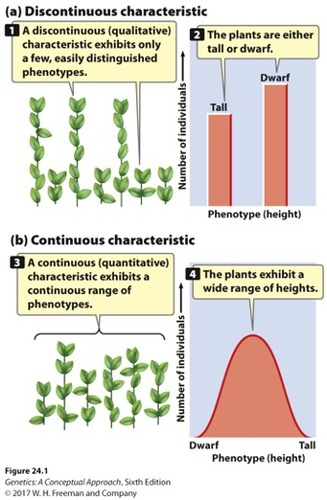
2. Discontinuous vs. Continuous Variation
Discontinuous Variation:
- Definition:
Traits that show distinct, separate categories with no intermediates. - Characteristics:
- Typically controlled by one or a few genes.
- No overlapping or intermediate forms.
- Examples:
- Blood Types: A, B, AB, O.
- Flower Color in Certain Plants: Red vs. white flowers.
- Sex in Humans: Male and female.
Continuous Variation:
- Definition:
Traits that show a range of phenotypes with intermediate forms. - Characteristics:
- Controlled by multiple genes (polygenic inheritance).
- Strongly influenced by environmental factors.
- Traits display a gradient or spectrum.
- Examples:
- Height in Humans: Varies widely with many intermediate heights.
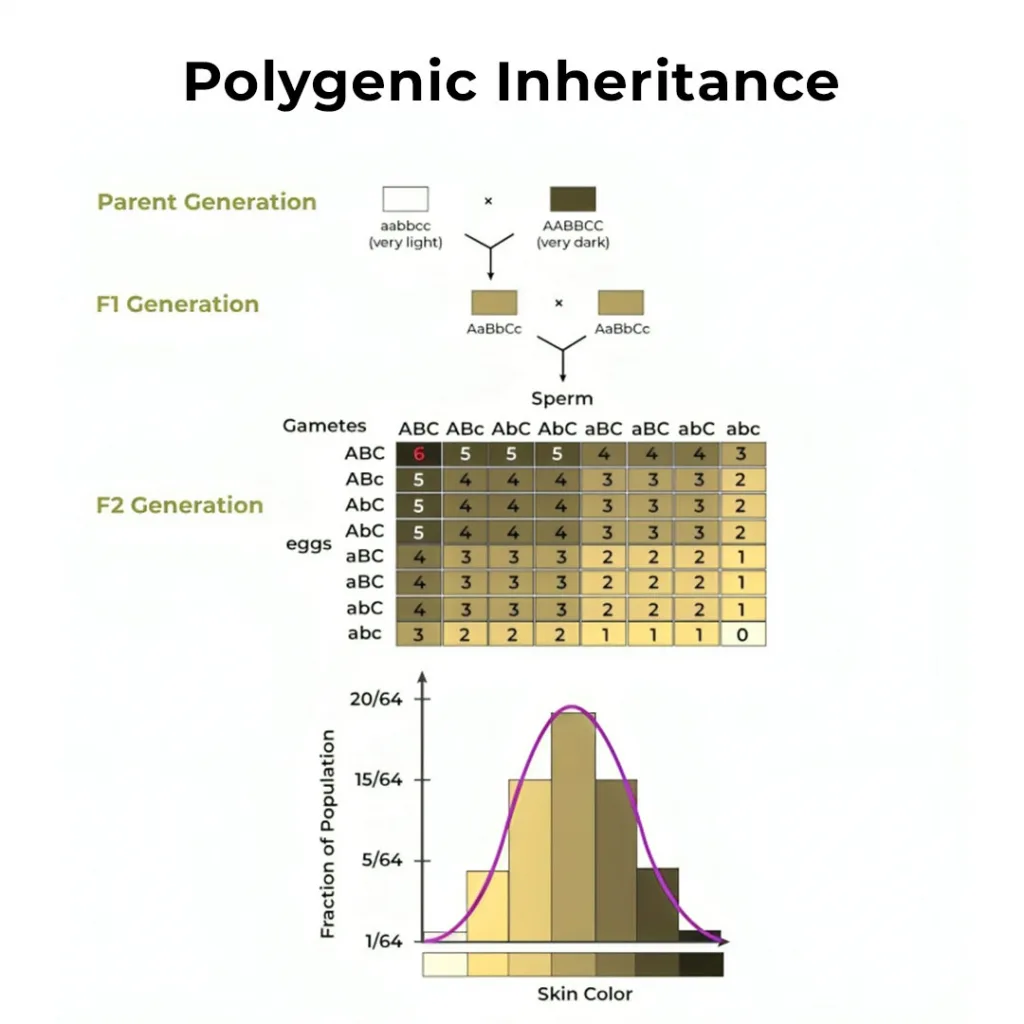
- Skin Color: A continuous range from light to dark.
- Weight in Animals: From very light to very heavy.
Essential Diagrams/Figures:
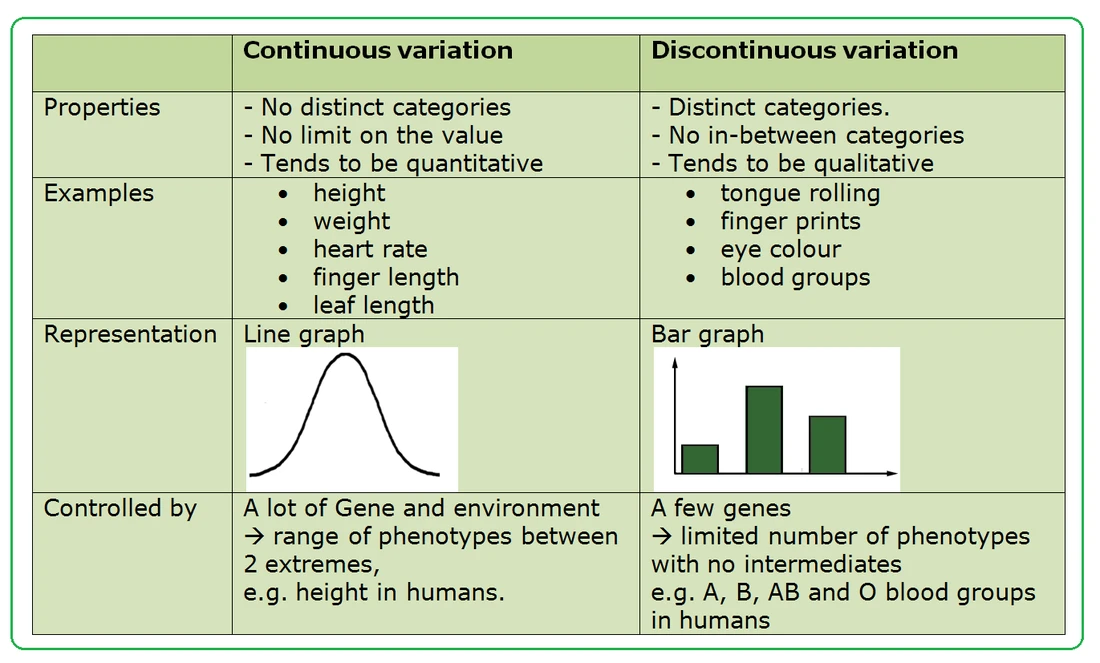
- Diagram 3:Graphs Illustrating Discontinuous vs. Continuous Variation
- Bar graph showing distinct categories for discontinuous variation.
- Bell curve representing continuous variation.
- Diagram 4: Examples of Discontinuous and Continuous Traits
Visual examples contrasting the two types of variation.
3. Genetic Basis of Discontinuous and Continuous Variation
Discontinuous Variation:
- Genetic Control:
- Controlled by one gene with multiple alleles or by multiple genes each with two alleles.
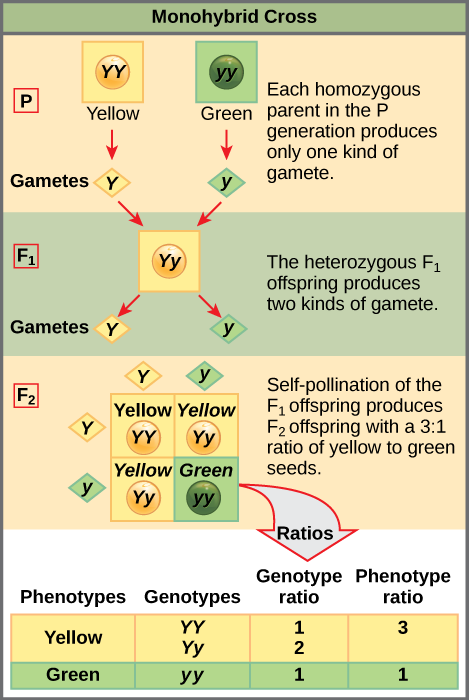
- Mendelian Inheritance: Follows patterns of dominant and recessive alleles.
- Inheritance Patterns:
- Monohybrid Crosses: Predict phenotypic ratios (e.g., 3:1 in pea plant traits).
- Dihybrid Crosses: Involve two traits simultaneously (e.g., seed shape and color).
- Example:
- Flower Color in Peas: Purple (dominant) vs. white (recessive).
Continuous Variation:
- Genetic Control:
- Controlled by multiple genes (polygenes) contributing additively to the phenotype.
- Polygenic Inheritance: No single gene determines the trait; instead, several genes contribute to the final phenotype.
- Environmental Influence:
- Environmental factors significantly affect the expression of polygenic traits.
- Example:
- Human Height: Influenced by the combined effect of multiple genes and environmental factors like nutrition.
Essential Diagrams/Figures:
- Diagram 5: Punnett Square for Discontinuous Traits
Example: Monohybrid cross showing dominant and recessive alleles.
- Diagram 6: Polygenic Inheritance Diagram
Illustrating how multiple genes contribute to a continuous trait like height.
- Diagram 7: Genetic vs. Environmental Influence on Continuous Traits
Showing the interaction between multiple genes and environmental factors.
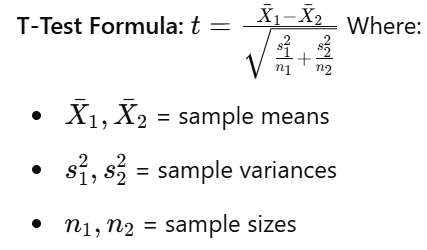
4. Using the T-Test to Compare Means of Two Different Samples
Definition:
A statistical method used to determine if there is a significant difference between the means of two groups.
When to Use:
- Comparing the average values of two independent samples.
- Applicable when data is approximately normally distributed and variances are equal.
T-Test Formula:
Steps to Perform a T-Test:
- State the Hypotheses:
- Null Hypothesis (H₀): There is no significant difference between the two means.
- Alternative Hypothesis (H₁): There is a significant difference between the two means.
- Calculate the T-Statistic:
- Use the formula provided to compute the t-value.
- Determine Degrees of Freedom (df): df=n1+n2−2
- Find the Critical T-Value:
- Refer to the t-distribution table based on df and chosen significance level (e.g., 0.05).
- Compare T-Statistic with Critical T-Value:
- If ∣t∣ > critical t, reject H₀.
- Draw Conclusions:
- Interpret whether the difference between means is statistically significant.
Example:
- Comparing average heights of plants grown under two different light conditions.
5. Natural Selection
Definition: Natural selection is the process whereby individuals with traits better adapted to their environment tend to survive and reproduce more successfully than others, leading to the gradual evolution of populations.
Key Concepts:
- Population Growth and Competition:
- Populations have the capacity to produce more offspring than the environment can support.
- This leads to competition for limited resources such as food, shelter, and mates.
- Struggle for Existence:
- Coined by Charles Darwin, it refers to the competition among individuals to survive and reproduce.
- Influenced by both biotic factors (e.g., predators, diseases) and abiotic factors (e.g., climate, habitat).
- Variation and Heredity:
- Individuals within a population show variation in their traits.
- Traits that confer a survival or reproductive advantage are more likely to be passed on to the next generation through alleles.
- Survival and Reproduction:
- Individuals best adapted to their environment are more likely to survive to reproductive age.
- These individuals pass on advantageous alleles to their offspring, gradually shifting allele frequencies in the population.
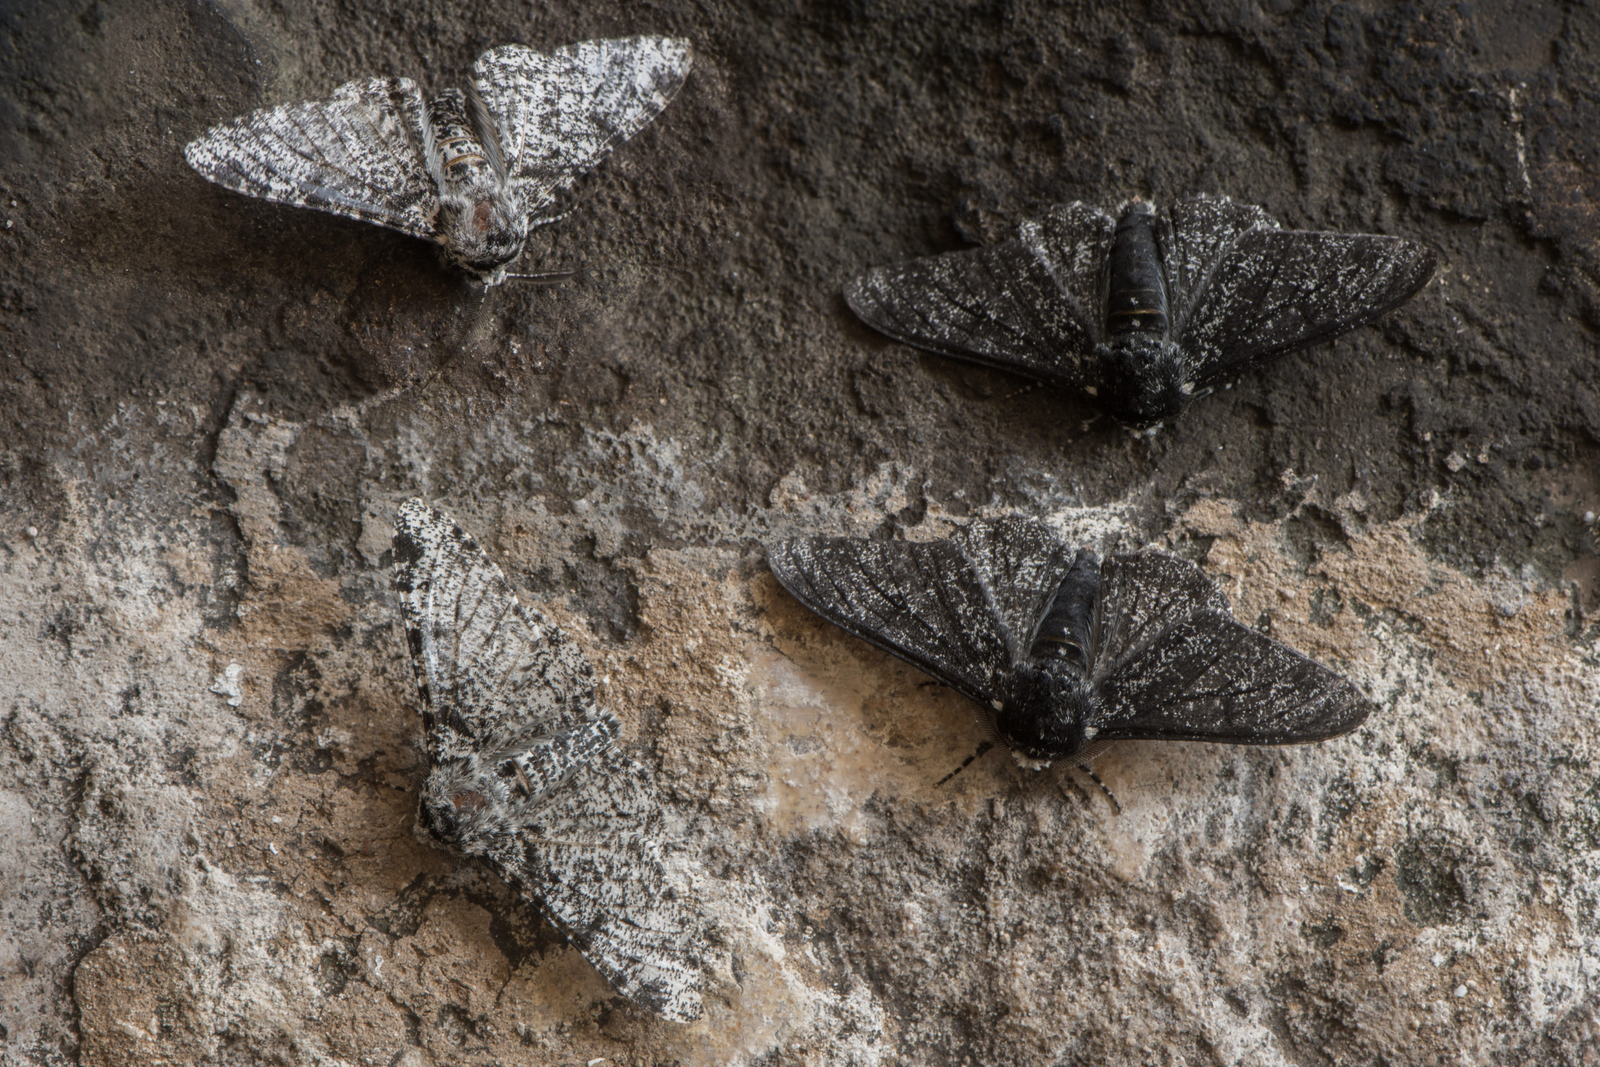
Example: The peppered moth in England, where dark-colored moths became more prevalent in industrial areas due to better camouflage against soot-darkened trees, enhancing their survival against predators.
6. Environmental Factors as Forces of Natural Selection
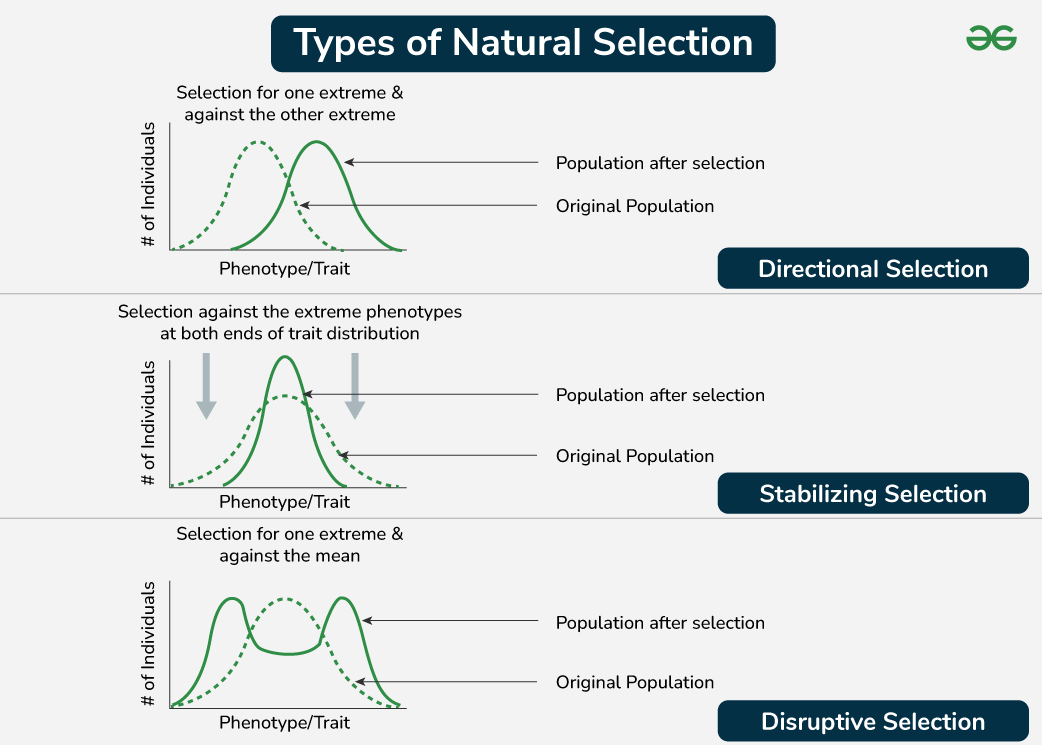
Natural selection can act in various ways depending on environmental pressures:
- Stabilizing Selection:
- Favors the average phenotype and selects against extreme traits.
- Example: Human birth weights, where both very low and very high weights have higher mortality rates, favoring average weights.
- Directional Selection:
- Favors one extreme phenotype over others.
- Example: The increase in antibiotic-resistant bacteria, where resistant strains survive and propagate while others die off.
- Disruptive Selection:
- Favors individuals at both extremes of the phenotypic range.
- Example: Beak sizes in certain bird populations where both very large and very small beaks are advantageous, but medium beaks are less so.
Diagram Explanation: The distribution of a trait in a population before and after selection, showing shifts corresponding to stabilizing, directional, and disruptive selection.
7. Factors Affecting Allele Frequencies in Populations
Several mechanisms influence the genetic makeup of populations:
- Natural Selection:
- Changes allele frequencies based on differential survival and reproduction.
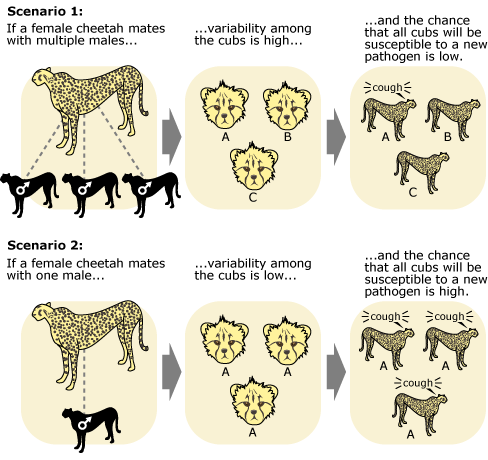
- Genetic Drift:
- Random changes in allele frequencies, more pronounced in small populations.
- Founder Effect: Occurs when a new population is established by a small number of individuals, potentially leading to reduced genetic variation and different allele frequencies compared to the original population.
- Bottleneck Effect: Happens when a population is drastically reduced in size due to events like natural disasters, leading to a loss of genetic diversity and altered allele frequencies.
Example: The cheetah population has low genetic diversity due to historical bottleneck events, making them more susceptible to diseases and reducing adaptability.
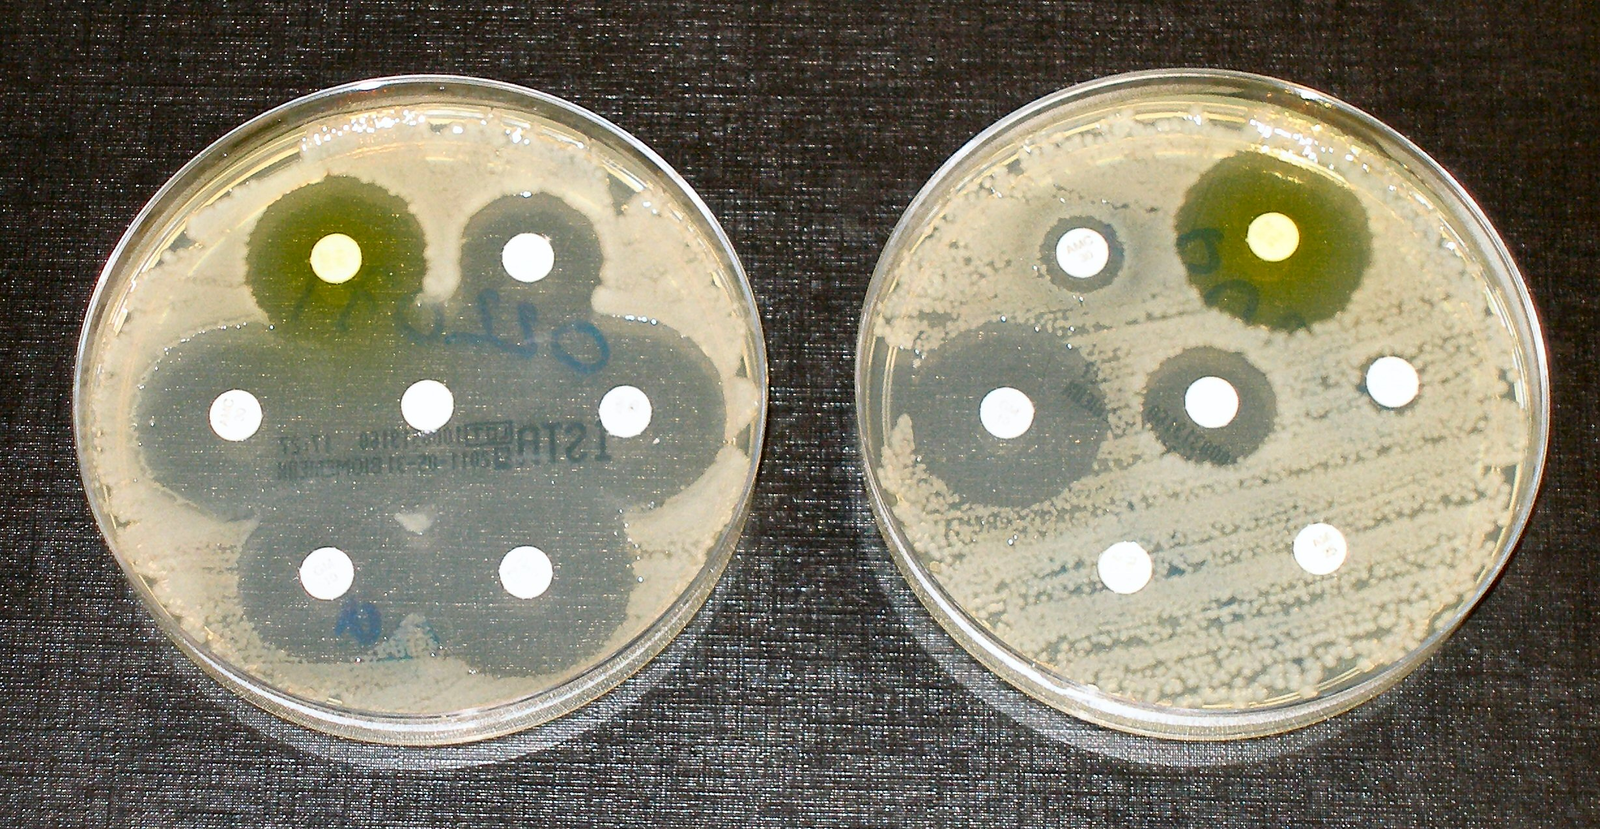
8. Natural Selection Example: Antibiotic Resistance in Bacteria
Process:
- Variation: Bacterial populations have genetic variation, some of which confer resistance to antibiotics.
- Exposure to Antibiotic: When an antibiotic is introduced, susceptible bacteria are killed, while resistant ones survive.
- Reproduction: Resistant bacteria reproduce, passing on resistance genes to their offspring.
- Population Shift: Over time, the population becomes predominantly resistant to the antibiotic.
Implications: This leads to challenges in treating bacterial infections, necessitating the development of new antibiotics and alternative treatments.
Diagram Explanation: A population of bacteria before and after antibiotic exposure, highlighting the increase in resistant individuals.
9. Hardy–Weinberg Principle
- Definition: The Hardy–Weinberg principle provides a mathematical model to study genetic variation in a population under ideal conditions where allele frequencies remain constant.
Conditions for Hardy–Weinberg Equilibrium:
- Large Population Size: Minimizes genetic drift.
- No Mutation: Prevents new alleles from entering the population.
- No Migration: No gene flow from other populations.
- Random Mating: No mate selection based on genotype or phenotype.
- No Natural Selection: All genotypes have equal fitness.
Hardy–Weinberg Equations:
- Allele Frequencies: p+q=1
- ppp = frequency of dominant allele
- qqq = frequency of recessive allele
- Genotype Frequencies: p2+2pq+q2=1
- p2 = frequency of homozygous dominant genotype
- 2pq = frequency of heterozygous genotype
- q2 = frequency of homozygous recessive genotype
Application Example: If a population has a recessive phenotype frequency (q2q^2q2) of 0.04, then:
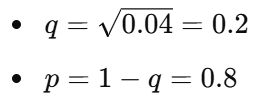
- Genotype frequencies:
- p2 = 0.64 (homozygous dominant)
- 2pq = 0.32 (heterozygous)
- q2 = 0.04 (homozygous recessive)
Significance: The principle serves as a null hypothesis for detecting evolutionary changes in populations.
10. Artificial Selection (Selective Breeding)
- Definition: Artificial selection is the intentional breeding of organisms by humans to enhance desired traits.
Principles:
- Selection of Parent Stock:
- Individuals with preferred traits are chosen as parents for the next generation.
- Controlled Breeding:
- Breeding is managed to increase the frequency of specific alleles associated with desirable traits.
- Generation of Uniformity:
- Over successive generations, traits become more pronounced and uniform within the population.
Contrast with Natural Selection: While natural selection is driven by environmental pressures, artificial selection is guided by human preferences and goals.
11. Examples of Selective Breeding
a. Disease Resistance in Wheat and Rice:
- Objective: Introduce and enhance resistance to specific diseases, ensuring higher yields and crop stability.
- Method:
- Identify varieties with natural resistance.
- Crossbreed these varieties to combine resistance traits.
- Select offspring that exhibit enhanced resistance.
b. Inbreeding and Hybridisation in Maize:
- Inbreeding:
- Mating of closely related individuals to increase homozygosity, fixing desirable traits.
- Hybridisation:
- Crossing genetically diverse individuals to produce hybrid offspring with superior vigor and uniformity (heterosis).
- Outcome: Development of maize varieties that are vigorous, uniform in growth, and high-yielding.
c. Improving Milk Yield in Dairy Cattle:
- Objective: Increase the quantity and quality of milk produced.
- Method:
- Select bulls and cows with the highest milk production records.
- Use artificial insemination to propagate desired traits.
- Result: Dairy herds with significantly higher milk yields, improved fat content, and better overall productivity.
Diagram Explanation: Flowchart illustrating the selective breeding process from selection of parent stock to the development of improved varieties.
12. Theory of Evolution
1.1. Introduction to Evolution
- Definition: Evolution is the change in the heritable characteristics of biological populations over successive generations.
- Significance: Explains the diversity of life on Earth and the relationships between different organisms.
1.2. Key Components of Evolution
- Genetic Variation: Differences in DNA among individuals within a population.
- Sources: Mutations, gene flow, sexual reproduction.
- Inheritance: Traits are passed from parents to offspring through genes.
- Differential Reproduction: Some individuals are more likely to survive and reproduce based on their traits.
- Time: Evolutionary changes occur over long periods.
1.3. Mechanisms of Evolution
- Natural Selection:
- Definition: The process whereby organisms better adapted to their environment tend to survive and produce more offspring.
- Types:
- Directional Selection: Favors one extreme phenotype.
- Stabilizing Selection: Favors intermediate phenotypes.
- Disruptive Selection: Favors both extreme phenotypes.
- Genetic Drift:
- Definition: Random changes in allele frequencies in a population, significant in small populations.
- Examples: Bottleneck effect, founder effect.
- Mutation:
- Definition: Changes in DNA sequences that introduce new genetic variation.
- Types: Point mutations, insertions, deletions.
- Gene Flow:
- Definition: Transfer of alleles or genes from one population to another.
- Impact: Increases genetic diversity within populations.
1.4. Speciation
- Definition: The formation of new and distinct species in the course of evolution.
- Process: Accumulation of genetic differences that prevent interbreeding between populations.
13. DNA Sequence Data and Evolutionary Relationships
2.1. Molecular Biology Basics
- DNA Structure: Double helix composed of nucleotides (adenine, thymine, cytosine, guanine).
- Genes: Segments of DNA that code for proteins.
- Genome: Complete set of genetic material in an organism.
2.2. DNA Sequencing
- Techniques:
- Sanger Sequencing: Chain-termination method for determining nucleotide sequences.
- Next-Generation Sequencing (NGS): High-throughput sequencing technologies allowing rapid sequencing of large DNA segments.
- Applications:
- Identifying genetic mutations.
- Comparing genetic material between species.
2.3. Phylogenetics
- Definition: The study of evolutionary relationships among species.
- Phylogenetic Trees:
- Structure: Branches represent evolutionary lineages.
- Nodes: Common ancestors.
- Tips: Current species.
- Molecular Clock Hypothesis:
- Concept: DNA mutations accumulate at a relatively constant rate over time.
- Usage: Estimating the time of divergence between species.
2.4. Comparative Genomics
- Purpose: Comparing the genomes of different species to identify similarities and differences.
- Insights:
- Shared genes indicate common ancestry.
- Genetic similarities reflect evolutionary relatedness.
2.5. Examples
- Human and Chimpanzee DNA: Approximately 98-99% identical, indicating a recent common ancestor.
- Birds and Reptiles: Shared genetic markers support the evolutionary link between these groups.
14. Speciation through Genetic Isolation
- Speciation occurs when populations of a species become isolated, preventing gene flow and allowing genetic differences to accumulate. This can happen through various forms of genetic isolation:
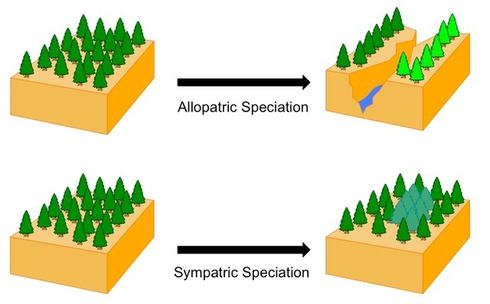
3.1. Allopatric Speciation (Geographical Separation)
- Definition: Speciation that occurs when populations are geographically separated by physical barriers.
- Mechanisms:
- Vicariance: Formation of a barrier (e.g., mountain range, river) splits a population.
- Dispersal: A subgroup moves to a new habitat.
- Outcomes:
- Independent genetic divergence due to mutation, genetic drift, and natural selection.
- Reproductive isolation even if geographical barriers are removed.
- Examples:
- Darwin’s Finches: Different species evolved on the Galápagos Islands due to geographic isolation.
- Siberian and American Wolves: Separated by the Bering Strait, leading to distinct species.
3.2. Sympatric Speciation (Ecological and Behavioural Separation)
- Definition: Speciation that occurs within a single geographic area, without physical barriers.
- Mechanisms:
- Ecological Isolation: Different populations exploit different ecological niches.
- Example: Insect populations adapting to different host plants.
- Behavioural Isolation: Differences in mating behaviours or rituals prevent interbreeding.
- Example: Different bird species with distinct mating calls.
- Temporal Isolation: Different breeding times (season, time of day).
- Example: Two frog populations breeding at different times.
- Ecological Isolation: Different populations exploit different ecological niches.
- Outcomes:
- Genetic divergence due to selective pressures and behavioural changes.
- Reproductive isolation despite overlapping geographic ranges.
- Examples:
- Cichlid Fish in African Lakes: Diverse species evolved through ecological specialization.
- Apple Maggot Fly: Shift from hawthorn to apple trees leading to reproductive isolation.
15. Additional Concepts
4.1. Adaptive Radiation
- Definition: Rapid evolution of diversely adapted species from a common ancestor upon introduction to new environments.
- Example: The variety of finch species on the Galápagos Islands.
4.2. Convergent and Divergent Evolution
- Convergent Evolution: Unrelated species evolve similar traits due to similar environmental pressures.
- Example: Wings in bats and birds.
- Divergent Evolution: Related species evolve different traits, leading to increased diversity.
- Example: The forelimbs of mammals (e.g., human arms vs. whale flippers).
4.3. Speciation Continuum
- Stages:
- Population Differentiation: Initial genetic differences accumulate.
- Prezygotic Isolation: Barriers prevent mating or fertilization.
- Postzygotic Isolation: Hybrid offspring are inviable or sterile.
16. Diagrams and Illustrations
5.1. Phylogenetic Tree
- Illustrates the evolutionary relationships between different species based on DNA sequence data.
5.2. Speciation Models
- Allopatric Speciation Diagram: Shows a population split by a geographical barrier leading to two distinct species.
- Sympatric Speciation Diagram: Illustration of a single population diverging into two species without physical separation.
QUESTIONS
1. Explain how genetic and environmental factors affect phenotypic variation.
- Genetic Factors:
- The genotype determines the potential characteristics of an organism.
- Meiosis, random mating, and random fertilization introduce genetic diversity within populations.
- Mutations: The only way to introduce new alleles into a population.
- Environmental Factors:
- The environment influences the extent to which genetic potential is expressed (e.g., nutrition affects height).
- Environmentally induced traits are not inherited; only genetic factors are passed to offspring.
2. Explain the differences between continuous and discontinuous variation.
- Continuous Variation:
- Range of values with many intermediates (e.g., height, weight).
- Often influenced by multiple genes (polygenic traits) and environmental factors.
- Results in a normal distribution curve in large populations.
- Discontinuous Variation:
- Distinct categories with no intermediates (e.g., ABO blood groups).
- Controlled by single genes or a small number of genes.
- Environment has little to no effect on these traits.
3. Explain how natural selection takes place, including reference to the development of antibiotic resistance in bacteria.
- Natural Selection:
- Variation exists within populations due to genetic diversity.
- Selection Pressures: Environmental factors (e.g., predators, climate) favor individuals with advantageous traits.
- Survival and Reproduction: Organisms with beneficial alleles survive and reproduce more successfully.
- Result: Over generations, allele frequencies shift, favoring traits that confer a survival advantage.
- Antibiotic Resistance:
- Initial Variation: Some bacteria may randomly develop resistance through mutation.
- Antibiotic Exposure: Non-resistant bacteria die, while resistant bacteria survive.
- Reproduction: Resistant bacteria reproduce, spreading the resistance allele.
- Outcome: Over time, the population becomes predominantly resistant to the antibiotic.
4. Explain the differences between stabilizing, disruptive, and directional selection.
- Stabilizing Selection:
- Maintains average traits by selecting against extreme phenotypes.
- Reduces genetic diversity, leading to more uniform populations.
- Example: Human birth weight; very high or low birth weights have higher mortality.
- Directional Selection:
- Favours one extreme phenotype over others.
- Shifts allele frequencies in a specific direction over time.
- Example: Antibiotic resistance in bacteria; selection favors resistant individuals.
- Disruptive Selection:
- Favours both extremes, leading to two distinct forms within a population.
- Can lead to speciation if extremes diverge significantly.
- Example: Beak sizes in birds adapted to different food sources.
5. Explain how the founder effect and genetic drift may affect allele frequencies.
- Genetic Drift:
- Random fluctuations in allele frequencies, especially impactful in small populations.
- Can lead to allele fixation or loss by chance, unrelated to selection.
- Founder Effect:
- Occurs when a new population starts with a small group of individuals.
- Reduced Genetic Variation: New population may lack some alleles from the original population.
- Impact on Evolution: The small gene pool may lead to rapid divergence from the parent population.
6. Use the Hardy–Weinberg equations.
- Equations:
- ( p + q = 1 ): Where ( p ) is the frequency of the dominant allele and ( q ) the recessive allele.
- ( p2 + 2pq + q2 = 1 ): Where ( p2 ) represents homozygous dominant, ( 2pq ) heterozygous, and ( q2 ) homozygous recessive frequencies.
- Application Example:
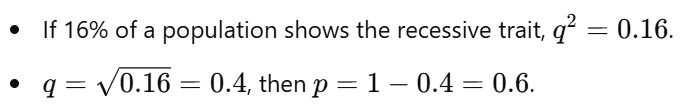
- Genotype Frequencies:
- Homozygous dominant ( p2) = 0.62 = 0.36.
- Heterozygous ( 2pq ) = 2 x 0.6 x 0.4 = 0.48.
- Homozygous recessive ( q2 ) = 0.16.
7. Describe the principles of selective breeding, including examples.
- Selective Breeding:
- Humans choose organisms with desired traits for reproduction.
- Traits are selected over generations, resulting in populations expressing specific phenotypes.
- Examples:
- Dairy Cattle: Bred for high milk yield by selecting cows and bulls with high-yield relatives.
- Crops: Wheat or rice varieties bred for disease resistance or high yield.
8. Outline the theory of evolution in terms of changes to gene pools.
- Theory of Evolution:
- Evolution is the change in allele frequencies within a gene pool over generations.
- Natural Selection: Favors beneficial alleles, increasing their frequency.
- Mutation: Introduces new alleles, adding to genetic diversity.
- Genetic Drift: Random changes in small populations can shift allele frequencies.
- Gene Flow: Movement of alleles between populations increases diversity.
- Result: Over time, populations adapt, and new species may form due to accumulated genetic differences.
9. Explain how new species can be formed by allopatric and sympatric processes.
- Allopatric Speciation:
- Geographic Isolation: Physical barriers (e.g., mountains, rivers) prevent gene flow between populations.
- Divergent Evolution: Different selection pressures lead to distinct adaptations.
- Outcome: Reproductive isolation develops, resulting in two distinct species.
- Sympatric Speciation:
- Occurs within the same area due to ecological or behavioral isolation.
- Ecological Isolation: Different environmental niches or resources drive genetic divergence.
- Behavioral Isolation: Differences in mating behavior prevent interbreeding.
- Example: Cichlid fish in the same lake evolve different feeding behaviors and preferences.
10. Discuss the use of DNA sequencing to determine relationships between species.
DNA Sequencing:
- Comparison of nucleotide sequences provides insight into evolutionary relationships.
- More Similar DNA: Suggests recent common ancestry.
- Differences in DNA: Indicate time since divergence; the more differences, the longer the separation.
Applications:
- Mitochondrial DNA (mtDNA): Inherited maternally, useful for tracing lineage and studying human evolution.
- Molecular Clock: Assumes a constant mutation rate to estimate divergence times.
- Example: Humans share 98% of DNA with chimpanzees, suggesting close evolutionary ties.