12.11 Chapter Summary
BioCast:
1. The Need for Energy in Living Organisms
a. Importance of Energy:
- Metabolic Processes: All living organisms require energy to carry out metabolic processes. These processes include both catabolic (breaking down molecules to release energy) and anabolic (building up molecules using energy) reactions.
b. Applications of Energy:
- Active Transport:
- Definition: Movement of molecules against their concentration gradient.
- Example: Sodium-potassium pump in animal cells.
- Energy Requirement: Utilizes ATP to transport ions across the cell membrane.
- Movement:
- Muscle Contraction: Requires ATP for the interaction between actin and myosin filaments.
- Cellular Motility: Flagella and cilia movement in cells depend on ATP-driven processes.
- Anabolic Reactions:
- DNA Replication:
- Process: Synthesis of DNA from nucleotides.
- Energy Source: ATP is required for the formation of phosphodiester bonds.
- Protein Synthesis:
- Process: Translation of mRNA into polypeptide chains.
- Energy Source: GTP and ATP are used during the initiation, elongation, and termination phases.
- DNA Replication:
2. Features of ATP as the Universal Energy Currency
a. Structure of ATP:
- Components: Adenine base, ribose sugar, and three phosphate groups.
- High-Energy Bonds: The bonds between phosphate groups, especially the bond between the second and third phosphate (terminal phosphate), are high-energy bonds that release energy upon hydrolysis.
b. Suitability as Energy Currency:
- Energy Release: Hydrolysis of ATP to ADP and inorganic phosphate releases approximately 30.5 kJ/mol of energy under standard conditions.
- Reversible Reactions: ATP can be regenerated from ADP and inorganic phosphate, allowing continuous energy cycling.
- Universal Usage: ATP is used by all living organisms, from prokaryotes to eukaryotes, making it a universal energy carrier.
- Versatility: ATP can transfer energy to various biochemical reactions, including muscle contractions, nerve impulse propagation, condensate dissolution, and chemical synthesis.
c. Additional Features:
- Solubility: ATP is highly soluble in water, facilitating its transport within cells.
- Small Size: Allows for rapid diffusion within cells to where energy is needed.
3. ATP Synthesis Mechanisms
- ATP is synthesized through two primary mechanisms:
a. Transfer of Phosphate in Substrate-Linked Reactions
Process:
- Substrate-Level Phosphorylation: Direct transfer of a phosphate group from a substrate molecule to ADP to form ATP.
Examples:
- Glycolysis:
- Reaction: 1,3-Bisphosphoglycerate + ADP → 3-Phosphoglycerate + ATP
- Enzyme Involved: Phosphoglycerate kinase
- Citric Acid Cycle:
- Reaction: Succinyl-CoA + ADP + Pi → Succinate + ATP + CoA
- Enzyme Involved: Succinyl-CoA synthetase
Key Points:
- Occurs in the cytoplasm (glycolysis) and mitochondrial matrix (citric acid cycle).
- Does not require oxygen (anaerobic).
b. Chemiosmosis in Membranes of Mitochondria and Chloroplasts
Process:
- Oxidative Phosphorylation (Mitochondria):
- Electron Transport Chain (ETC): Electrons are transferred through a series of protein complexes in the inner mitochondrial membrane.
- Proton Gradient: Pumping of protons (H⁺) into the intermembrane space creates a proton gradient.
- ATP Synthase: Protons flow back into the mitochondrial matrix through ATP synthase, driving the synthesis of ATP from ADP and Pi.
- Photophosphorylation (Chloroplasts):
- Light-Dependent Reactions: Light energy excites electrons, initiating the ETC in the thylakoid membrane.
- Proton Gradient: Protons are pumped into the thylakoid lumen, creating a gradient.
- ATP Synthase: Protons flow back into the stroma through ATP synthase, producing ATP.
Key Points:
- Dependence on Electron Carriers: NADH and FADH₂ donate electrons to the ETC.
- Role of Oxygen: In mitochondria, oxygen acts as the final electron acceptor, forming water.
- ATP Yield: Significantly higher ATP production compared to substrate-level phosphorylation.
4. Relative Energy Values of Carbohydrates, Lipids, and Proteins as Respiratory Substrates
a. Energy Content per Gram:
- Carbohydrates: Approximately 16 kJ/g
- Proteins: Approximately 16 kJ/g
- Lipids (Fats): Approximately 38 kJ/g
b. Comparative Analysis:
- Lipids: Highest energy density, making them efficient for long-term energy storage.
- Carbohydrates and Proteins: Lower energy density; carbohydrates are preferred for quick energy needs, while proteins are primarily used for structural and functional roles but can be catabolized for energy when necessary.
c. Respiration Substrates:
- Carbohydrates: Glucose is a primary substrate, entering glycolysis directly.
- Lipids: Broken down into fatty acids and glycerol; fatty acids enter β-oxidation to form acetyl-CoA.
- Proteins: Amino acids are deaminated and converted into intermediates that enter the citric acid cycle.
d. Efficiency:
- ATP Yield per Mole: Lipids yield more ATP per molecule compared to carbohydrates and proteins due to their higher degree of reduction (more electrons available for the ETC).
e. Practical Implications:
- Energy Storage: Organisms store energy as carbohydrates (e.g., glycogen) and lipids (e.g., triglycerides), utilizing them based on energy demand and availability.
Table:
| Substrate | Energy per Gram (kJ/g) | Pathway Involved | ATP Yield Potential |
|---|---|---|---|
| Carbohydrates | 16 | Glycolysis, Citric Acid Cycle | Moderate |
| Proteins | 16 | Deamination → Citric Acid Cycle | Variable |
| Lipids | 38 | β-Oxidation, Citric Acid Cycle | High |
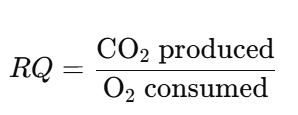
5. Respiratory Quotient (RQ)
a. Definition:
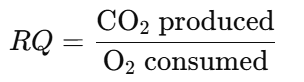
- Respiratory Quotient (RQ): The ratio of the number of molecules of carbon dioxide (CO₂) produced to the number of molecules of oxygen (O₂) consumed during respiration.
b. Significance:
- Metabolic Indicator: RQ provides insights into which substrates (carbohydrates, lipids, proteins) are being predominantly metabolized for energy.
- Physiological Applications: Helps in understanding metabolic states in different physiological conditions (e.g., fasting, exercise).
c. Typical RQ Values:
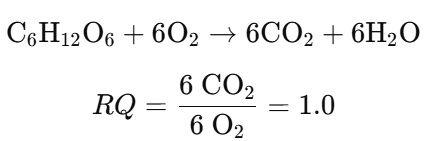
- Carbohydrate Metabolism: RQ ≈ 1.0
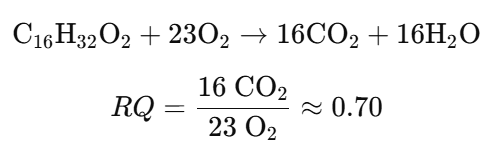
- Fat Metabolism: RQ ≈ 0.7
- Protein Metabolism: RQ ≈ 0.8
d. Interpretation:
- RQ = 1: Indicates carbohydrate oxidation.
- RQ < 1: Suggests lipid oxidation.
- RQ > 1: Can occur during lipogenesis (formation of fats) or anaerobic respiration (e.g., lactic acid fermentation).
6. Calculating RQ Values of Different Respiratory Substrates
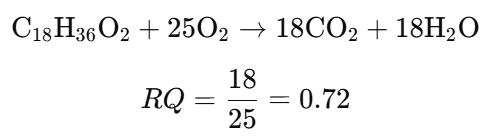
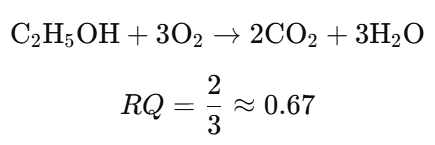
a. General Formula:

b. Calculating RQ from Respiratory Equations:
Example 1: Carbohydrate (Glucose) Oxidation
Example 2: Fat (Palmitic Acid) Oxidation
Example 3: Protein (Alanine) Oxidation

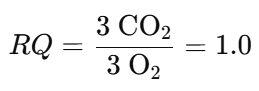
{(Note: Actual RQ for proteins is approximately 0.8 due to varied metabolic pathways)}
c. Steps to Calculate RQ:
- Write the balanced equation for the oxidation of the substrate.
- Identify the moles of CO₂ produced and moles of O₂ consumed.
- Apply the RQ formula to find the ratio.
d. Practice Problems:
- Calculate the RQ for the oxidation of stearic acid (C₁₈H₃₆O₂):
- Determine the RQ for the oxidation of ethanol (C₂H₅OH):
e. Important Notes:
- RQ Values May Vary: Depending on the exact metabolic pathways and conditions, actual RQ values can slightly differ from theoretical values.
- Mixed Substrates: In reality, organisms often metabolize a mixture of substrates, resulting in intermediate RQ values.
7. Investigations Using Respirometers to Determine RQ
a. Purpose of Respirometry:
- Measurement of Gas Exchange: Respirometers are used to measure the rate of oxygen consumption and carbon dioxide production by living organisms.
- Determining RQ: By quantifying these gas exchanges, the RQ can be calculated to infer the predominant metabolic substrates.
b. Types of Respirometers:
- Closed Respirometers: Measure the decrease in O₂ and increase in CO₂ within a sealed chamber.
- Open Respirometers: Often use bicarbonate indicators to measure changes in gas concentrations.
- Flow Respirometers: Continuously measure gas exchange in flowing air.
c. Experimental Setup for Germinating Seeds or Small Invertebrates (e.g., Blowfly Larvae):
Materials:
- Respirometer Apparatus: Includes a sealed chamber, gas collection tubes (e.g., Kipp’s tubes), and indicators for gas concentration.
- Organism: Germinating seeds (e.g., beans) or small invertebrates (e.g., blowfly larvae).
- O₂ Indicator: Such as a dye that changes color in response to O₂ levels.
- CO₂ Indicator: Such as a pH indicator that changes color in response to CO₂ levels.
Procedure:
- Preparation:
- Place a known number of seeds or larvae in the respirometer chamber.
- Ensure the chamber is airtight to prevent gas exchange with the environment.
- Initial Measurements:
- Record the initial volume of O₂ and CO₂.
- Establish baseline gas concentrations before the experiment begins.
- Incubation:
- Allow the organisms to respire within the chamber for a set period.
- Maintain constant temperature and light conditions as required.
- Final Measurements:
- After the incubation period, measure the final volumes of O₂ consumed and CO₂ produced.
- Use indicators or gas collection methods to quantify the changes.
- Calculation:
- Apply the RQ formula:
- Analyze the RQ value to determine the predominant metabolic substrate.
d. Data Analysis:
- Interpretation of RQ Values:
- RQ ≈ 1.0: Predominant carbohydrate metabolism.
- RQ < 1.0: Predominant lipid metabolism.
- RQ ≈ 0.8: Mixed metabolism or protein metabolism.
- Graphical Representation:
- Plot O₂ consumption against CO₂ production to visualize metabolic trends.
e. Example Investigation:
- Objective: Determine the RQ of germinating bean seeds to infer their metabolic substrates during germination.
Steps:
- Setup:
- Place a known weight of dry bean seeds in the respirometer.
- Seal the chamber and ensure no leaks.
- Incubate:
- Keep the chamber at a controlled temperature suitable for germination.
- Observation:
- Monitor gas changes over 24 hours.
- Measurements:
- Record the decrease in O₂ and increase in CO₂.
- Calculation:
- Suppose 0.5 mol O₂ consumed and 0.45 mol CO₂ produced.
- RQ:
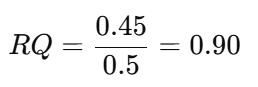
- Interpretation: Predominant carbohydrate metabolism during seed germination.
f. Precautions:
- Airtight Seals: Ensure no leaks to maintain accurate gas measurements.
- Controlled Conditions: Maintain constant temperature and other environmental factors.
- Replication: Perform multiple trials for reliability.
g. Extensions:
- Comparative Studies: Compare RQ values under different environmental conditions (e.g., light vs. dark for photosynthetic organisms).
- Substrate Variation: Alter the available substrates to observe changes in RQ.
8. Locations of the Four Stages of Aerobic Respiration in Eukaryotic Cells
- Glycolysis
- Location: Cytoplasm
- Description: The breakdown of glucose into pyruvate, producing a small amount of ATP and NADH.
- Link Reaction (Pyruvate Oxidation)
- Location: Mitochondrial Matrix
- Description: Conversion of pyruvate into acetyl-CoA, releasing CO₂ and producing NADH.
- Krebs Cycle (Citric Acid Cycle)
- Location: Mitochondrial Matrix
- Description: Acetyl-CoA enters the cycle, undergoing a series of reactions that produce ATP, NADH, FADH₂, and CO₂.
- Oxidative Phosphorylation (Electron Transport Chain and Chemiosmosis)
- Location: Inner Mitochondrial Membrane
- Description: Electrons from NADH and FADH₂ pass through the electron transport chain, driving the production of ATP via ATP synthase. Oxygen acts as the final electron acceptor, forming water.
9. Glycolysis: Detailed Overview
- Glycolysis is the first stage of cellular respiration and occurs in the cytoplasm. It involves the phosphorylation and splitting of glucose into two molecules of pyruvate.
Steps of Glycolysis:
- Phosphorylation of Glucose:
- Initial Substrate: Glucose (6C)
- Process: Glucose is phosphorylated to glucose-6-phosphate using ATP.
- Importance: Traps glucose inside the cell and destabilizes it for cleavage.
- Splitting of Fructose 1,6-bisphosphate:
- Molecule: Fructose 1,6-bisphosphate (6C)
- Process: Splits into two triose phosphate molecules (3C each).
- Result: Two molecules of glyceraldehyde-3-phosphate.
- Oxidation to Pyruvate:
- Process: Each triose phosphate is oxidized to form pyruvate (3C).
- Products:
- ATP: Produced via substrate-level phosphorylation.
- NADH: Reduced from NAD⁺ during oxidation.
Net Products of Glycolysis (per glucose molecule):
- ATP: 2 (4 produced – 2 consumed)
- NADH: 2
- Pyruvate: 2
10. Entry of Pyruvate into Mitochondria (Link Reaction)
- When oxygen is available (aerobic conditions), pyruvate produced in glycolysis enters the mitochondria to participate in the link reaction.
Process:
- Transport: Pyruvate is transported from the cytoplasm into the mitochondrial matrix via specific transport proteins.
- Necessity of Oxygen: Oxygen is not directly used in the link reaction but is required for the subsequent stages of aerobic respiration.
11. The Link Reaction (Pyruvate Oxidation)
- The link reaction bridges glycolysis and the Krebs cycle. It occurs in the mitochondrial matrix and involves the conversion of pyruvate into acetyl-CoA.
Steps:
- Decarboxylation:
- Process: Pyruvate (3C) loses one carbon as CO₂.
- Result: Acetyl group (2C) remains.
- Formation of Acetyl-CoA:
- Role of Coenzyme A (CoA): Acetyl group is attached to CoA, forming acetyl-CoA.
- Production: NADH is generated from NAD⁺ during the oxidation.
Importance of Coenzyme A:
- Function: Acts as a carrier for the acetyl group, facilitating its entry into the Krebs cycle.
- Structure: Contains a thiol (-SH) group that forms a thioester bond with the acetyl group.
12. The Krebs Cycle (Citric Acid Cycle)
- The Krebs cycle takes place in the mitochondrial matrix and is a series of enzymatic reactions that further oxidize acetyl-CoA, producing energy carriers and CO₂.
Key Steps:
- Formation of Citrate:
- Reactants: Acetyl-CoA (2C) + Oxaloacetate (4C)
- Product: Citrate (6C)
- Conversion Back to Oxaloacetate:
- Process: Citrate undergoes a series of transformations, releasing two molecules of CO₂ and regenerating oxaloacetate.
- Intermediates: Includes intermediates like isocitrate, α-ketoglutarate, succinyl-CoA, and others.
Net Products per Acetyl-CoA:
- ATP: 1 (via substrate-level phosphorylation)
- NADH: 3
- FADH₂: 1
- CO₂: 2
Overall Cycle:
- For Each Glucose Molecule: Since one glucose yields two acetyl-CoA molecules, the cycle turns twice per glucose molecule.
13. Reactions in the Krebs Cycle: Decarboxylation and Dehydrogenation
Decarboxylation:
- Definition: Removal of carbon atoms from acetyl-CoA in the form of CO₂.
- Occurrence: Happens twice per acetyl-CoA as it is converted back to oxaloacetate.
Dehydrogenation:
- Definition: Removal of hydrogen atoms during oxidation reactions.
- Products: Hydrogen atoms are transferred to coenzymes NAD⁺ and FAD, forming NADH and FADH₂.
Reduction of Coenzymes:
- NAD⁺: Reduced to NADH (gains two electrons and one proton).
- FAD: Reduced to FADH₂ (gains two electrons and two protons).
14. Role of NAD and FAD in the Electron Transport Chain
- NAD⁺ and FAD are essential coenzymes that act as electron carriers.
Functions:
- NADH and FADH₂:
- Electron Carriers: Transport high-energy electrons to the electron transport chain (ETC) on the inner mitochondrial membrane.
- Hydrogen Transfer: Donate electrons and hydrogen atoms to carriers in the ETC, facilitating the generation of a proton gradient.
Importance:
- Energy Transfer: The electrons from NADH and FADH₂ provide the energy necessary for ATP synthesis during oxidative phosphorylation.
15. Oxidative Phosphorylation: Detailed Process
- Oxidative phosphorylation encompasses the electron transport chain and chemiosmosis, leading to the production of ATP.
Steps:
- Hydrogen Atom Splitting:
- Process: Hydrogen atoms from NADH and FADH₂ split into protons (H⁺) and energetic electrons.
- Electron Transport Chain (ETC):
- Movement: Energetic electrons pass through a series of protein carriers embedded in the inner mitochondrial membrane.
- Energy Release: As electrons move down the ETC, energy is released.
- Proton Gradient Formation:
- Energy Utilization: Released energy is used to pump protons (H⁺) from the mitochondrial matrix to the intermembrane space, creating a proton gradient.
- ATP Synthesis via Chemiosmosis:
- Proton Return: Protons flow back into the mitochondrial matrix through ATP synthase via facilitated diffusion.
- ATP Production: The flow of protons provides the energy needed to synthesize ATP from ADP and inorganic phosphate (Pi).
- Final Electron Acceptor:
- Role of Oxygen: Oxygen accepts the electrons at the end of the ETC and combines with protons to form water (H₂O).
Key Points:
- Efficiency: Oxidative phosphorylation produces the majority of ATP during aerobic respiration.
- ATP Yield: Approximately 34 ATP molecules are generated per glucose molecule through this process.
16. Structure and Function of Mitochondria
- Mitochondria are the powerhouse of the cell, specialized for energy production through respiration.
Structural Features:
- Double Membrane:
- Outer Membrane: Smooth and permeable to small molecules and ions.
- Inner Membrane: Highly folded into structures called cristae, increasing surface area for the electron transport chain.
- Matrix:
- Contents: Enzymes, mitochondrial DNA, ribosomes, and intermediates of the Krebs cycle.
- Function: Site of the Krebs cycle and the link reaction.
- Intermembrane Space:
- Function: Area between the inner and outer membranes where protons are pumped during oxidative phosphorylation.
Functional Relationship:
- Surface Area: The extensive folding (cristae) of the inner membrane provides a large surface area for the electron transport chain and ATP synthesis.
- Compartmentalization: Separation of processes into different mitochondrial compartments enhances efficiency and regulation of respiration.
Diagrams:
- Electron Micrographs: Show the double-membrane structure with visible cristae.
- Functional Diagrams: Illustrate the locations of glycolysis, the link reaction, Krebs cycle, and oxidative phosphorylation.
17. Anaerobic Respiration: Fermentation Pathways
- When oxygen is not available, cells undergo anaerobic respiration to regenerate NAD⁺, allowing glycolysis to continue.
In Mammals: Lactate Fermentation
- Process:
- Pyruvate Conversion: Pyruvate is reduced to lactate (lactic acid) by lactate dehydrogenase.
- NAD⁺ Regeneration: NADH is oxidized to NAD⁺, enabling glycolysis to continue.
- Context: Occurs in muscle cells during intense exercise when oxygen supply is limited.
In Yeast Cells: Ethanol Fermentation
- Process:
- Pyruvate Decarboxylation: Pyruvate is converted to acetaldehyde, releasing CO₂.
- Ethanol Formation: Acetaldehyde is reduced to ethanol by alcohol dehydrogenase, regenerating NAD⁺.
- Applications: Used in brewing and baking industries.
Key Differences:
- End Products: Lactate in animals vs. ethanol and CO₂ in yeast.
- Enzymes Involved: Different enzymes catalyze the respective reactions in animals and yeast.
18. Energy Yield: Aerobic vs. Anaerobic Respiration
Aerobic Respiration:
- Yield: Approximately 36-38 ATP per glucose molecule.
- Efficiency: High energy yield due to complete oxidation of glucose.
- Stages Involved: Glycolysis, link reaction, Krebs cycle, oxidative phosphorylation.
Anaerobic Respiration:
- Yield: Only 2 ATP per glucose molecule (from glycolysis).
- Efficiency: Low energy yield as glucose is only partially oxidized.
- Reason for Lower Yield:
- Limited pathways: Glycolysis followed by fermentation.
- Absence of the electron transport chain and oxidative phosphorylation, which produce the majority of ATP in aerobic conditions.
Conclusion:
- Oxygen Availability: Determines the pathway and efficiency of ATP production.
- Adaptation: Organisms utilize anaerobic pathways to sustain ATP production when oxygen is scarce, despite the lower energy yield.
19. Adaptations of Rice to Submerged Conditions
- Rice (Oryza sativa) can grow in waterlogged conditions due to several anatomical and physiological adaptations.
Key Adaptations:
- Aerenchyma Development in Roots:
- Structure: Specialized tissue with large air spaces.
- Function: Facilitates the transport of oxygen from the aerial parts to submerged roots.
- Ethanol Fermentation in Roots:
- Process: Anaerobic respiration pathway that allows root cells to generate ATP when oxygen is limited.
- Products: Ethanol and CO₂, regenerating NAD⁺ for glycolysis.
- Faster Growth of Stems:
- Hydraulic Lift: Rapid stem growth can help in the creation of air channels and transport of oxygen.
- Support: Enhanced stem growth provides structural support in flooded environments.
Importance:
- Survival: These adaptations enable rice plants to maintain metabolic functions and growth despite submerged conditions.
- Agricultural Relevance: Understanding these mechanisms is crucial for improving rice cultivation in waterlogged fields.
20. Investigations Using Redox Indicators: Effects on Yeast Respiration
Redox Indicators:
- DCPIP (2,6-Dichlorophenol-indophenol):
- Function: Changes color from blue (oxidized) to colorless (reduced).
- Use: Measures the rate of electron transfer during respiration.
- Methylene Blue:
- Function: Changes color from blue (oxidized) to colorless (reduced).
- Use: Indicates the presence of active respiration; remains blue when respiration is halted.
Investigative Procedures:
- Effect of Temperature on Yeast Respiration:
- Setup: Yeast solution with DCPIP or methylene blue, incubated at different temperatures.
- Observation: Measure the rate at which the indicator changes color.
- Conclusion: Optimal temperature range for yeast activity; denaturation occurs at extreme temperatures.
- Effect of Substrate Concentration on Yeast Respiration:
- Setup: Varying concentrations of glucose in yeast solution with redox indicators.
- Observation: Rate of color change corresponds to respiration rate.
- Conclusion: Determines the saturation point where increasing substrate no longer increases the respiration rate.
Data Analysis:
- Rate Determination: Faster color change indicates higher respiration rates.
- Graphing Results: Plot indicator reduction against temperature or substrate concentration to identify trends and optimal conditions.
21. Investigations Using Simple Respirometers: Effect of Temperature on Respiration Rate
Respirometer Components:
- Yeast Solution: Acts as the biological component undergoing respiration.
- Respirometer Device: Typically includes a sealed container with a gas collection system (e.g., syringe or gas jar).
Experimental Procedure:
- Setup:
- Place a measured amount of yeast solution in the respirometer.
- Seal the device to allow gas accumulation.
- Temperature Variation:
- Incubate separate respirometers at different temperatures (e.g., 0°C, 20°C, 37°C, 50°C).
- Measurement:
- Record the volume of gas produced over a fixed time period.
- Use a gas collection syringe or measure pressure changes as indicators of respiration rate.
- Controls:
- Include a control respirometer kept at a baseline temperature (e.g., room temperature).
Observations and Conclusions:
- Optimal Temperature: Identify the temperature at which gas production (respiration rate) is highest.
- Effect of Temperature:
- Low Temperatures: Slower enzyme activity, reduced respiration rate.
- High Temperatures: Enzyme denaturation, decreased respiration rate.
- Graphing Results: Plot gas volume against temperature to visualize the relationship.
Importance:
- Understanding Metabolic Rates: Demonstrates how temperature affects enzymatic activities involved in respiration.
- Practical Applications: Useful in fields like biotechnology and environmental biology to optimize conditions for microbial growth.