03.12 Chapter Summary
BioCast
1. Enzyme Characteristics
Definition: Enzymes are globular proteins that act as biological catalysts.
Function: Speed up biochemical reactions without being consumed in the process.
Location:
- Intracellular Enzymes: Catalyze reactions inside cells.
- Extracellular Enzymes: Secreted outside cells to catalyze external reactions.
2. Mode of Action of Enzymes
Active Site:
- Definition: Specific region on the enzyme where the substrate binds.
- Characteristics: Highly specific shape and chemical environment.
Enzyme–Substrate Complex:
- Formation: Substrate molecules bind to the enzyme’s active site, forming the complex.
- Stabilization: The complex stabilizes the transition state, reducing activation energy.
Lowering of Activation Energy:
- Mechanism: Enzymes lower the energy barrier required for reactions, increasing reaction rates.
- Outcome: More efficient and faster biochemical reactions.
Enzyme Specificity:
Lock-and-Key Hypothesis:
- Concept: Enzyme and substrate fit together perfectly without any alteration.
- Implication: High specificity; only specific substrates fit into specific enzymes.
Induced-Fit Hypothesis:
- Concept: Enzyme undergoes a conformational change to fit the substrate upon binding.
- Implication: Flexibility in enzyme structure enhances specificity and catalytic efficiency.
3. Investigating Enzyme-Catalyzed Reactions
Measuring Reaction Rates:
Using Catalase:
- Function: Catalyzes the decomposition of hydrogen peroxide into water and oxygen.
- Measurement: Rate can be assessed by measuring the volume of oxygen gas produced over time.
Using Amylase:
- Function: Catalyzes the breakdown of starch into sugars.
- Measurement: Rate can be determined by measuring the decrease in starch concentration over time, often using iodine as an indicator.
Experimental Considerations:
- Control Variables: Temperature, pH, enzyme concentration, and substrate concentration should be controlled.
- Data Collection: Collect data at regular intervals to accurately determine reaction rates.
4. Using a Colorimeter to Measure Enzyme Reactions
Colorimeter Basics:
- Function: Measures the absorbance of specific wavelengths of light by a solution.
- Application: Detects color changes associated with enzyme-catalyzed reactions.
Procedure:
- Prepare Samples: Set up reaction mixtures with the enzyme and substrate.
- Add Indicator: Use a color-changing reagent (e.g., iodine for starch with amylase).
- Measure Absorbance: At specific time intervals, use the colorimeter to measure absorbance changes.
- Interpret Results: Correlate absorbance changes to substrate concentration or product formation.
Advantages:
- Quantitative Data: Provides precise measurements of reaction progress.
- Real-Time Monitoring: Allows continuous tracking of reaction kinetics.
5. Factors Affecting the Rate of Enzyme-Catalysed Reactions
Introduction to Enzymes
- Enzymes are biological catalysts that speed up biochemical reactions without being consumed.
- Active Site: The specific region where substrates bind and reactions occur.
- Catalysis: Lowering the activation energy required for a reaction.
Factors Affecting the Rate of Enzyme-Catalysed Reactions
a. Temperature
- Effect:
- Increasing Temperature: Generally increases reaction rate by providing more kinetic energy, leading to more frequent collisions between enzymes and substrates.
- Optimal Temperature: Each enzyme has an optimal temperature at which its activity is highest.
- Denaturation: Beyond the optimal temperature, enzymes denature (lose their structure) and become inactive.
- Graph:
Rate vs. Temperature Optimal Point
b. pH (Using Buffer Solutions)
- Effect:
- Optimal pH: Each enzyme operates best at a specific pH.
- Deviation from Optimal pH: Alters the ionization of amino acids at the active site, affecting enzyme structure and function.
- Buffer Solutions: Maintain a stable pH, ensuring consistent enzyme activity.
- Example:
- Pepsin: Optimal pH ~2 (stomach).
- Trypsin: Optimal pH ~8 (small intestine).
c. Enzyme Concentration
- Effect:
- Increase in Enzyme Concentration: Higher enzyme levels increase the number of available active sites, boosting reaction rate.
- Saturation Point: At high enzyme concentrations with limited substrate, the reaction rate continues to increase.
d. Substrate Concentration
- Effect:
- Low Substrate Concentration: Rate increases linearly with substrate as more enzymes are occupied.
- High Substrate Concentration: Enzymes become saturated; rate approaches a maximum (Vₘₐₓ) and levels off.
- Graph:
Rate vs. Substrate Concentration
e. Inhibitor Concentration
Effect:
- Presence of Inhibitors: Decreases reaction rate by reducing effective enzyme concentration or altering active site.
- Competitive Inhibitors: Bind to active site, competing with substrate.
- Non-Competitive Inhibitors: Bind to allosteric site, altering enzyme structure and function.
6. Michaelis-Menten Kinetics
a. Maximum Rate of Reaction (Vₘₐₓ)
- Definition: The highest possible rate of reaction when the enzyme is saturated with substrate.
- Significance: Represents the efficiency of the enzyme under optimal conditions.
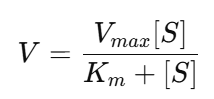
b. Michaelis–Menten Constant (Kₘ)
- Definition: Substrate concentration at which the reaction rate is half of Vₘₐₓ.
- Derivation: Kₘ is derived from the Michaelis-Menten equation:
Affinity Indicator:
- Low Kₘ: High affinity (enzyme reaches Vₘₐₓ at low substrate concentrations).
- High Kₘ: Low affinity (requires higher substrate concentrations to reach Vₘₐₓ).
- Usage: Comparing Kₘ values helps determine which enzyme has a higher affinity for its substrate.
7. Reversible Inhibitors
a. Competitive Inhibition
- Mechanism: Inhibitor resembles substrate and binds to the active site, preventing substrate binding.
- Effect on Kinetics:
- Vₘₐₓ: Remains unchanged (can be reached by increasing substrate concentration).
- Kₘ: Increases (higher substrate needed to achieve half Vₘₐₓ).
- Graphical Representation: Lineweaver-Burk plot shows lines intersecting on the Y-axis.
b. Non-Competitive Inhibition
- Mechanism: Inhibitor binds to an allosteric site, altering enzyme structure and function regardless of substrate presence.
Effect on Kinetics:
- Vₘₐₓ: Decreases (maximum rate cannot be achieved as some enzymes are always inhibited).
- Kₘ: Remains unchanged (affinity for substrate is unaffected).
- Graphical Representation: Lineweaver-Burk plot shows lines intersecting on the X-axis.
8. Enzyme Immobilisation
a. Activity: Immobilised vs. Free Enzymes
- Free Enzymes:
- Mobility: Can freely diffuse and interact with substrates.
- Stability: More susceptible to changes in environmental conditions (temperature, pH).
- Immobilised Enzymes:
- Fixed Position: Bound to a solid support (e.g., alginate).
- Stability: Enhanced resistance to denaturation and reuse in industrial processes.
b. Advantages of Using Immobilised Enzymes
- Reusability: Can be recovered and used multiple times, reducing costs.
- Stability: Increased thermal and pH stability extends enzyme lifespan.
- Ease of Separation: Simplifies product purification by easily separating enzymes from reaction mixtures.
- Controlled Environment: Immobilisation allows for better control over reaction conditions.
c. Example: Enzyme in Alginate
- Alginate Beads: Enzymes encapsulated in alginate gel retain activity while being immobilised.
Benefits:
- Protect enzymes from harsh conditions.
- Facilitate continuous processes in bioreactors.
9. The Fluid Mosaic Model of Membrane Structure
a. Overview
- Fluid Mosaic Model: Describes the cell membrane as a dynamic and flexible structure with various proteins embedded in or associated with a fluid phospholipid bilayer.
- Dynamic Nature: Lipids and proteins can move laterally within the layer, allowing membrane flexibility and the formation of specialized regions.
b. Phospholipid Bilayer Formation
- Phospholipids: Amphipathic molecules with hydrophilic (water-attracting) heads and hydrophobic (water-repellent) tails.
- Hydrophobic Interactions: Tails face inward, shielded from water, while heads face the aqueous environment, creating a stable bilayer.
- Hydrophilic Interactions: Polar head groups interact with the surrounding water, maintaining membrane integrity.
c. Protein Arrangement
- Integral Proteins: Span the entire bilayer (transmembrane proteins), involved in transport and signaling.
- Peripheral Proteins: Attached to the membrane surface, involved in signaling and maintaining the cell’s shape.
- Protein Mobility: Proteins can move laterally, contributing to membrane fluidity and functionality.
10. Arrangement of Cholesterol, Glycolipids, and Glycoproteins in Cell Surface Membranes
a. Cholesterol
- Location: Interspersed within the phospholipid bilayer.
- Function: Modulates membrane fluidity, making it less fluid at high temperatures and preventing it from becoming too rigid at low temperatures.
b. Glycolipids
- Structure: Lipids with carbohydrate chains attached.
- Location: Outer leaflet of the cell membrane.
- Function: Involved in cell recognition and protection.
c. Glycoproteins
- Function: Play roles in cell recognition, signaling, and adhesion.
- Structure: Proteins with carbohydrate chains attached.
- Location: Outer surface of the cell membrane.
Practise Questions
Question 1
Define enzymes and explain their role in catalysing metabolic reactions. (4 marks)
Mark Scheme:
- Enzymes are globular proteins that act as biological catalysts. (1 mark)
- They speed up metabolic reactions by lowering activation energy. (1 mark)
- Enzymes remain unchanged after the reaction and can be reused. (1 mark)
- They enable both breakdown reactions (e.g., large molecules into smaller ones) and synthesis reactions (e.g., smaller molecules joining to form larger ones). (1 mark)
Question 2
Describe how enzymes lower activation energy and outline the induced-fit hypothesis. (5 marks)
Mark Scheme:
- Enzymes lower the activation energy by providing an alternative reaction pathway with a lower energy barrier. (1 mark)
- This allows reactions to occur faster under physiological conditions. (1 mark)
- According to the induced-fit hypothesis, the enzyme’s active site is flexible and adjusts its shape to fit the substrate precisely. (1 mark)
- This enhances the binding of the substrate and facilitates the reaction. (1 mark)
- The enzyme-substrate complex forms temporarily, leading to the product’s formation. (1 mark)
Question 3
Explain the effects of temperature on enzyme activity, including the consequences of exceeding the optimum temperature. (6 marks)
Mark Scheme:
- As temperature increases, enzyme activity rises due to higher kinetic energy of molecules, leading to more frequent collisions. (1 mark)
- Enzyme activity is highest at the optimum temperature, where the enzyme functions most efficiently. (1 mark)
- Beyond the optimum temperature, excessive heat causes the enzyme’s tertiary structure to unravel. (1 mark)
- Denaturation occurs, altering the active site shape and preventing substrate binding. (1 mark)
- Denaturation is typically irreversible, and the enzyme becomes non-functional. (1 mark)
- Example: Human enzymes usually have an optimum temperature near 37°C. (1 mark)
Question 4
Compare the effects of competitive and non-competitive inhibitors on enzyme activity. (6 marks)
Mark Scheme:
- Competitive inhibitors compete with the substrate for the active site due to their similar shape. (1 mark)
- They temporarily block substrate binding, reducing reaction rate. (1 mark)
- Their effect is reversible by increasing substrate concentration. (1 mark)
- Non-competitive inhibitors bind to a site other than the active site, causing a conformational change in the enzyme. (1 mark)
- This alters the active site shape, preventing substrate binding and reducing activity. (1 mark)
- Increasing substrate concentration does not reverse non-competitive inhibition. (1 mark)
Question 5
Explain the significance of Vmax and Km in enzyme kinetics. (5 marks)
Mark Scheme:
- Vmax is the maximum reaction rate achieved when all enzyme active sites are saturated with substrate. (1 mark)
- It represents the enzyme’s maximum efficiency under given conditions. (1 mark)
- Km (Michaelis-Menten constant) is the substrate concentration at which the reaction rate is ½ Vmax. (1 mark)
- A low Km indicates high substrate affinity, meaning the enzyme binds the substrate efficiently. (1 mark)
- A high Km indicates low affinity, requiring more substrate to reach ½ Vmax. (1 mark)
Question 6
Describe how immobilised enzymes are produced and their advantages in industrial processes. (6 marks)
Mark Scheme:
- Immobilised enzymes are produced by mixing the enzyme with sodium alginate and dropping it into calcium chloride to form beads. (1 mark)
- The beads can be packed into a column, allowing substrate to flow through and react. (1 mark)
- Reusability: Immobilised enzymes can be used multiple times, reducing costs. (1 mark)
- Product purity: No enzyme contamination in the final product. (1 mark)
- Stability: Immobilised enzymes are more resistant to changes in pH and temperature, reducing denaturation risk. (1 mark)
- Example: Immobilised lactase is used to produce lactose-free milk. (1 mark)
Question 7
Outline the steps to measure the initial rate of an enzyme-catalysed reaction. (5 marks)
Mark Scheme:
- Prepare the enzyme and substrate solutions and mix them in a reaction vessel. (1 mark)
- Record the amount of product formed or substrate used at regular time intervals. (1 mark)
- Plot a graph of time (X-axis) vs. product formed or substrate used (Y-axis). (1 mark)
- Draw a tangent to the steepest part of the curve at the start of the reaction. (1 mark)
- Calculate the slope of the tangent to determine the initial rate of reaction. (1 mark)
Question 8
How do substrate and enzyme concentrations affect the rate of an enzyme-catalysed reaction? (6 marks)
Mark Scheme:
- Increasing substrate concentration raises the reaction rate until Vmax is reached, where all active sites are occupied. (1 mark)
- Beyond Vmax, adding more substrate does not increase the rate. (1 mark)
- Increasing enzyme concentration increases the reaction rate, provided substrate is not limiting. (1 mark)
- If substrate concentration is low, excess enzyme molecules remain idle. (1 mark)
- The reaction rate is proportional to enzyme concentration only when substrate is abundant. (1 mark)
- Both factors must be balanced to maximise reaction efficiency. (1 mark)
Question 9
Explain why immobilised enzymes are more stable than free enzymes. (4 marks)
Mark Scheme:
- Immobilised enzymes are partially protected by the matrix (e.g., alginate beads) that holds them in place. (1 mark)
- This reduces their exposure to extreme changes in temperature and pH. (1 mark)
- The matrix helps maintain the enzyme’s tertiary structure, preventing denaturation. (1 mark)
- Immobilised enzymes tolerate more extreme conditions, making them more stable in industrial processes. (1 mark)
Question 10
Describe how pH affects enzyme activity and explain what happens when pH deviates from the optimum. (6 marks)
Mark Scheme:
- Each enzyme has an optimum pH at which it works most efficiently. (1 mark)
- Deviations from the optimum can disrupt ionic bonds and alter the enzyme’s active site. (1 mark)
- This reduces the enzyme’s ability to bind the substrate, lowering reaction rate. (1 mark)
- Extreme pH deviations can cause denaturation, permanently changing the enzyme’s structure. (1 mark)
- Example: Pepsin works best at pH 1.5 in the stomach, while other enzymes function near pH 7. (1 mark)
- Enzymes adapted to different environments have specific pH tolerances (e.g., stomach vs. small intestine). (1 mark)